
Fig. 2. Anti–CTLA-4×SIRPα heterodimer preferentially depletes ICOShigh Treg cells in tumors.
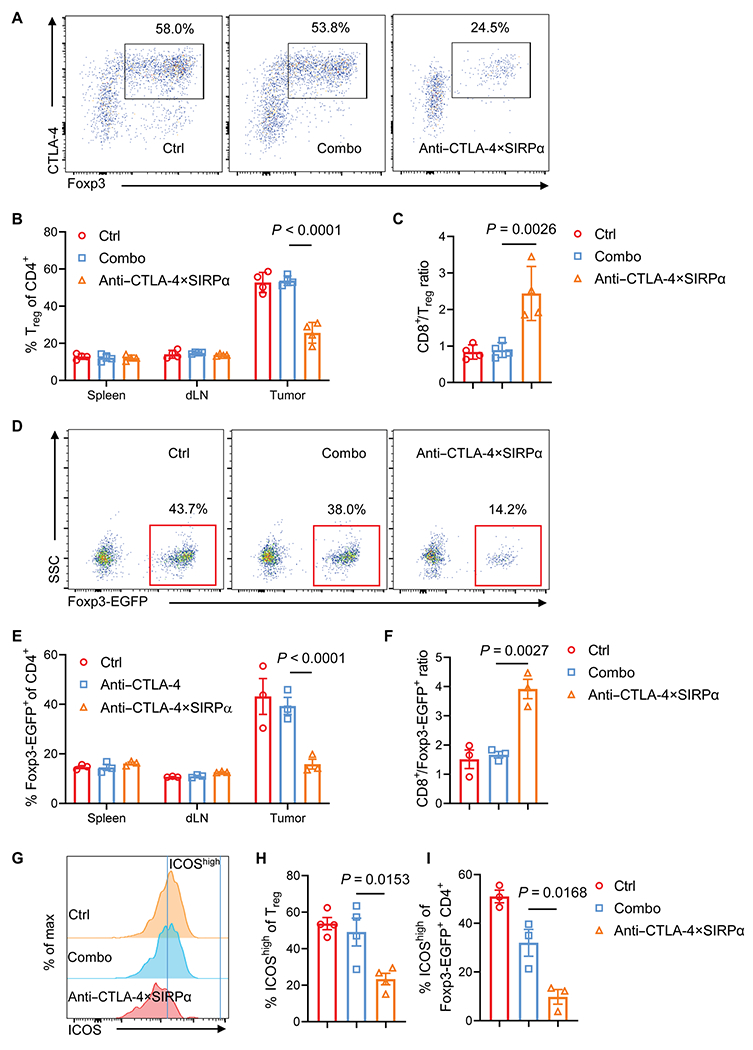
(A to C) C57BL/6 mice were inoculated with 5 × 10⁵ MC38 tumor cells and treated with Combo (anti–CTLA-4 and SIRPα) or anti–CTLA-4×SIRPα heterodimer on day 13. Control (Ctrl) mice were treated with hIgG. Five days later, Treg cells from tumor, spleen, and dLN were analyzed by flow cytometry (A). Treg cell frequency from different treatment groups (B) and the ratio of CD8+ T cells to Treg (C) were quantified (n = 4 mice per group). (D to F) Foxp3EGFP-cre mice were inoculated with 5 × 10⁵ MC38 tumor cells and treated with Combo or anti–CTLA-4×SIRPα on day 13. Ctrl mice were treated with hIgG. Five days later, Foxp3-EGFP+ cells isolated from tumors, spleens, and dLN were analyzed (D). Foxp3-EGFP+ cell frequency from indicated groups (E) and the ratio of CD8+ T cells to Foxp3-EGFP+ cells (F) were quantified (n = 3 mice per group). SSC, side scatter. (G to I) C57BL/6 mice or Foxp3EGFP-Cre mice were treated as above, and samples were stained for expression of ICOS (G). ICOShigh frequency among Treg cells isolated from C57BL/6 mice (H) and ICOShigh frequency among EGFP+ cells from Foxp3EGFP-cre mice (I) are shown (n = 3 to 4 per group). Data are shown as means ± SD from two to three independent experiments. P values were determined by two-way ANOVA with Tukey’s multiple comparisons test (B and E) or oneway ANOVA with Tukey’s multiple comparisons test (C, F, H, and I). The normality of data was confirmed by Shapiro-Wilk test.