
Fig. 4. Dual targeting of CTLA-4 and CD47 enhances tumor-specific T cell responses in an IFN-γ-dependent manner.
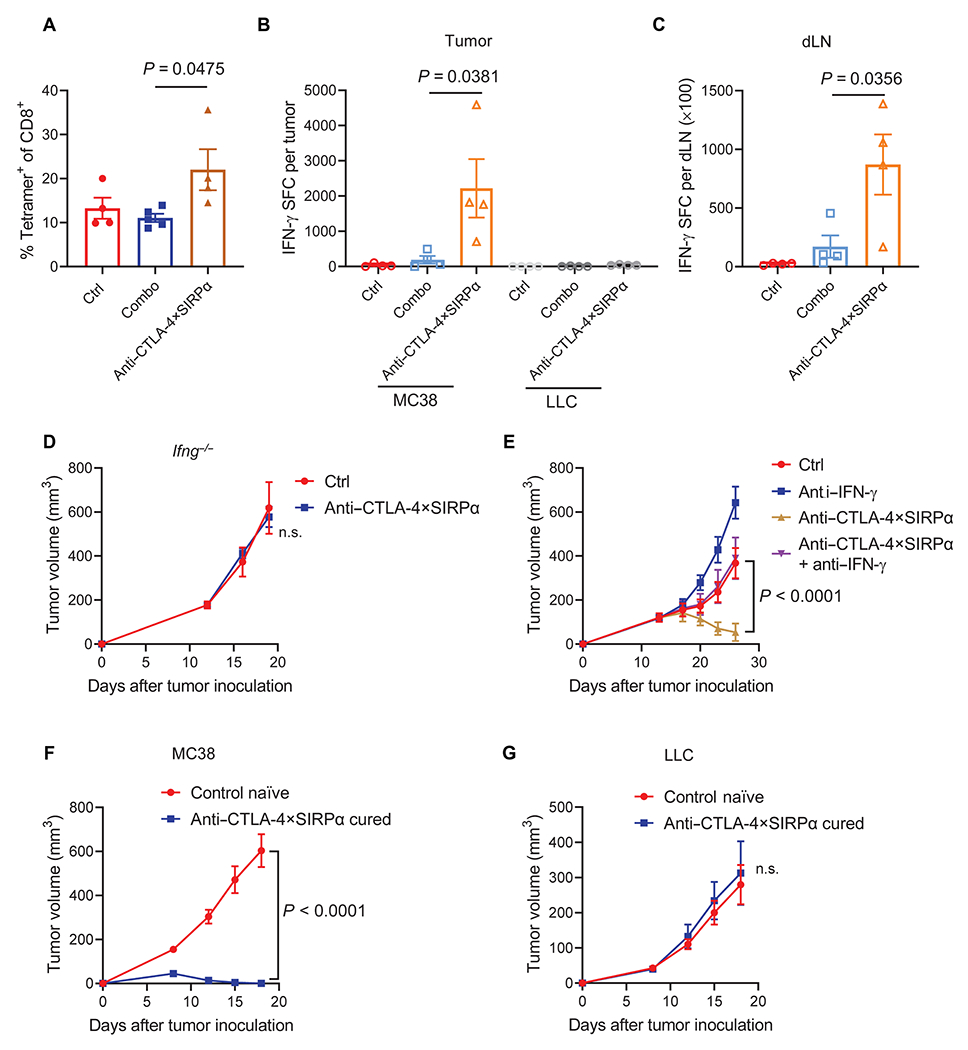
(A) C57BL/6 mice were inoculated with 5 × 10⁵ MC38 tumor cells and treated with Combo or anti–CTLA-4×SIRPα on day 13. Ctrl mice were treated with hIgG. Five days later, TILs were analyzed for tumor-specific T cells using an H-2Kb KSP(KSPWFTTL) tetramer. The frequency of tetramer+ cells of total CD8+ T cells was evaluated by flow cytometry (n = 4 to 5 mice per group). (B and C) C57BL/6 mice were inoculated with 5 × 10⁵ MC38 tumor cells and treated with Combo or anti–CTLA-4×SIRPα on day 13. Ctrl mice were treated with hIgG. Five days later, tumors and dLNs were isolated. TILs were purified with CD45-positive selection magnetic beads. TILs were restimulated with irradiated MC38 tumor cells or irrelevant control Lewis lung cancer (LLC) cells for 48 hours (B), and dLN cells were stimulated with irradiated MC38 tumor cells for 48 hours (C). IFN-γ-producing cell counts were determined by ELISPOT assay (n = 4 mice per group). SFC, spot-forming cells. (D) WT or Ifng−/− C57BL/6 mice were inoculated with 5 × 10⁵ MC38 tumor cells and treated with anti–CTLA-4×SIRPα on day 13. Ctrl mice were treated with hIgG. Tumor growth was measured every 3 days (n = 4 mice per group). (E) C57BL/6 mice were inoculated with 5 × 10⁵ MC38 tumor cells and treated with anti–CTLA-4×SIRPα on day 13. One hundred fifty micrograms of anti–IFN-γ was administrated 1 day before treatment initiation and then twice a week for 2 weeks. Ctrl mice were treated with hIgG. Tumor growth was measured every 3 days (n = 5 mice per group). (F and G) C57BL/6 mice were inoculated with 5 × 10⁵ MC38 tumor cells and treated with anti–CTLA-4×SIRPα on day 14. Six weeks later, anti–CTLA-4×SIRPα-cured mice and control naive mice were rechallenged with 5 × 10⁶ MC38 tumor cells on the left flank (opposite to the original injection flank) (F), and 5 × 10⁵ LLC tumor cells were injected on the right flank (G). Tumor growth was measured every 3 days (n = 5 mice per group). Data are shown as means ± SEM from two to three independent experiments. P values were determined by one-way ANOVA with Tukey’s multiple comparisons test (A to C) or two-way ANOVA with Geisser-Greenhouse’s correction (D to G). The normality of data was confirmed by Shapiro-Wilk test. n.s., P > 0.05.