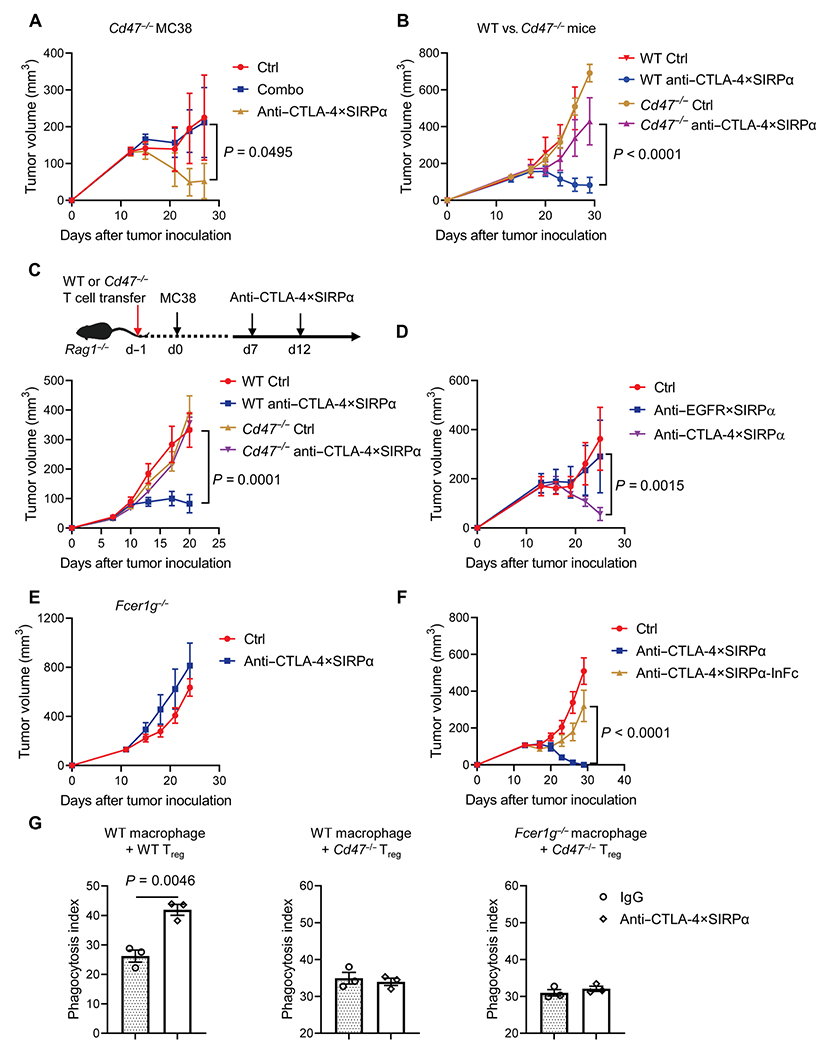
Fig. 5. CD47 expression on Treg cells is essential for anti–CTLA-4×SIRPα-mediated control of tumor burden.

(A) Cd47−/− tumor-bearing C57BL/6 mice were treated with Combo or anti–CTLA-4×SIRPα on day 13. Ctrl mice were treated with hIgG. Tumor growth was measured every 3 days (n = 5 mice per group). (B) WT or Cd47−/− C57BL/6 mice were inoculated with 5 × 10⁵ MC38 tumor cells and treated with anti–CTLA-4×SIRPα on day 14. Ctrl mice were treated with hIgG. Tumor growth was measured every 3 days (n = 5 mice per group). (C) WT or Cd47−/− T cells were purified and intravenously transferred to Rag1−/− mice. A total of 2 × 10⁵ MC38 tumor cells were inoculated into the recipient mice the next day. Mice were treated with 40 μg of anti–CTLA-4×SIRPα on days 7 and 12. Ctrl mice were treated with hIgG. Experiment scheme is shown in the top, and tumor growth is shown in the bottom (n = 5 mice per group). (D) C57BL/6 mice were inoculated with 5 × 10⁵ MC38-cEGFR tumor cells and treated with 30 μg of anti-EGFR×SIRPα or anti–CTLA-4×SIRPα on day 14. Ctrl mice were treated with hIgG. Tumor growth was measured every 3 days (n = 3 to 4 mice per group). (E) Fcer1g−/− C57BL/6 mice were inoculated with 1 × 10⁵ MC38 tumor cells and treated with anti–CTLA-4×SIRPα on day 13. Ctrl mice were treated with hIgG. Tumor growth was measured every 3 days (n = 5 mice per group). (F) WT C57BL/6 mice were inoculated with 5 × 10⁵ MC38 tumor cells and treated with anti–CTLA-4×SIRPα or anti–CTLA-4×SIRPα with mutant Fc (anti–CTLA-4×SIRPα-InFc) on day 14. Ctrl mice were treated with hIgG. Tumor growth was measured every 3 days (n = 5 mice per group). (G) BM–derived macrophages from WT or Fcer1g−/− mice were mixed with CFSE-labeled in vitro differentiated Treg cells from WT or Cd47−/− mice for 3 hours. Phagocytosis was determined by flow cytometry. Phagocytosis index was defined as the percentage of CFSE+ macrophages among total macrophages (n = 3 replicates per group). Data are shown as means ± SEM from two to three independent experiments. P values were determined by two-way ANOVA with Geisser-Greenhouse’s correction (A to D and F) or unpaired t test (G). The normality of data was confirmed by Shapiro-Wilk test.
