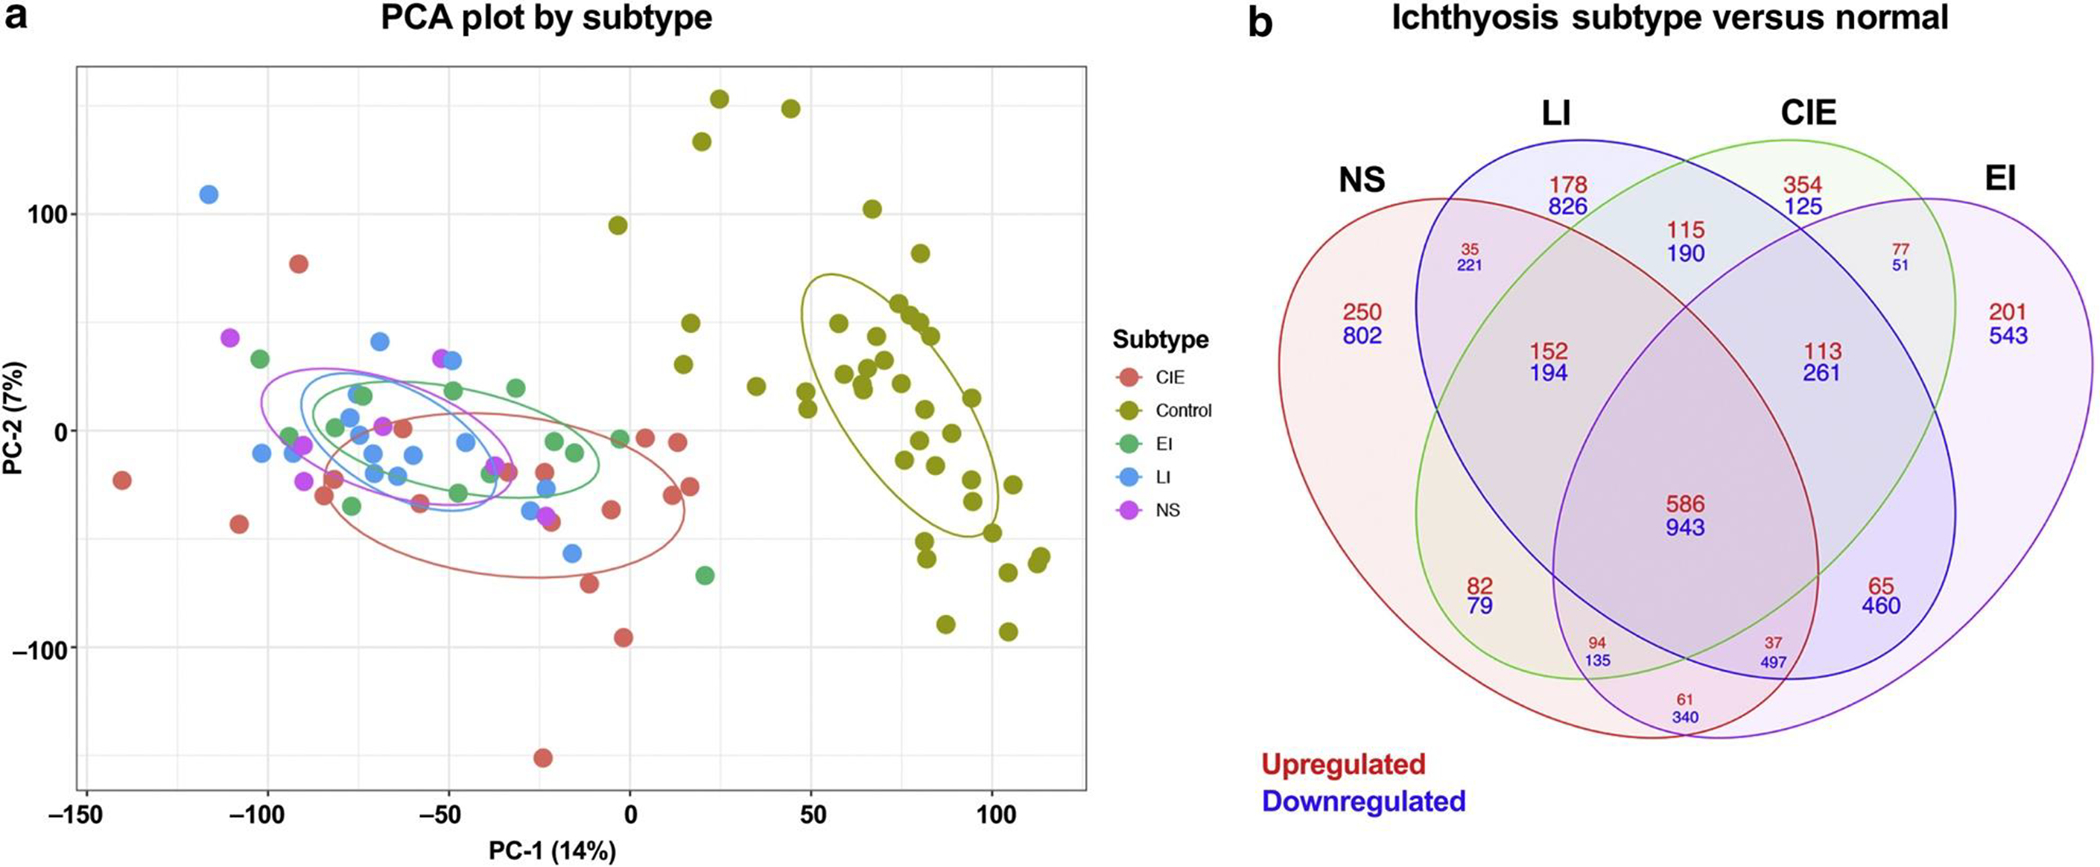
Figure 1. Overview of ichthyosis subtypes versus controls.

(a) PCA plot showing the ichthyosis subtypes NS, LI, CIE, and EI and controls. (b) Venn diagram showing DEGs comparing ichthyosis subtypes NS, LI, CIE, and EI with normal. Red denotes upregulated, and blue denotes downregulated. CIE, congenital ichthyosiform erythroderma; DEG, differentially expressed gene; EI, epidermolytic ichthyosis; LI, lamellar ichthyosis; NS, Netherton syndrome; PC-1, prinicpal component 1; PC-2, principal component 2; PCA, principal coordinate analysis.
