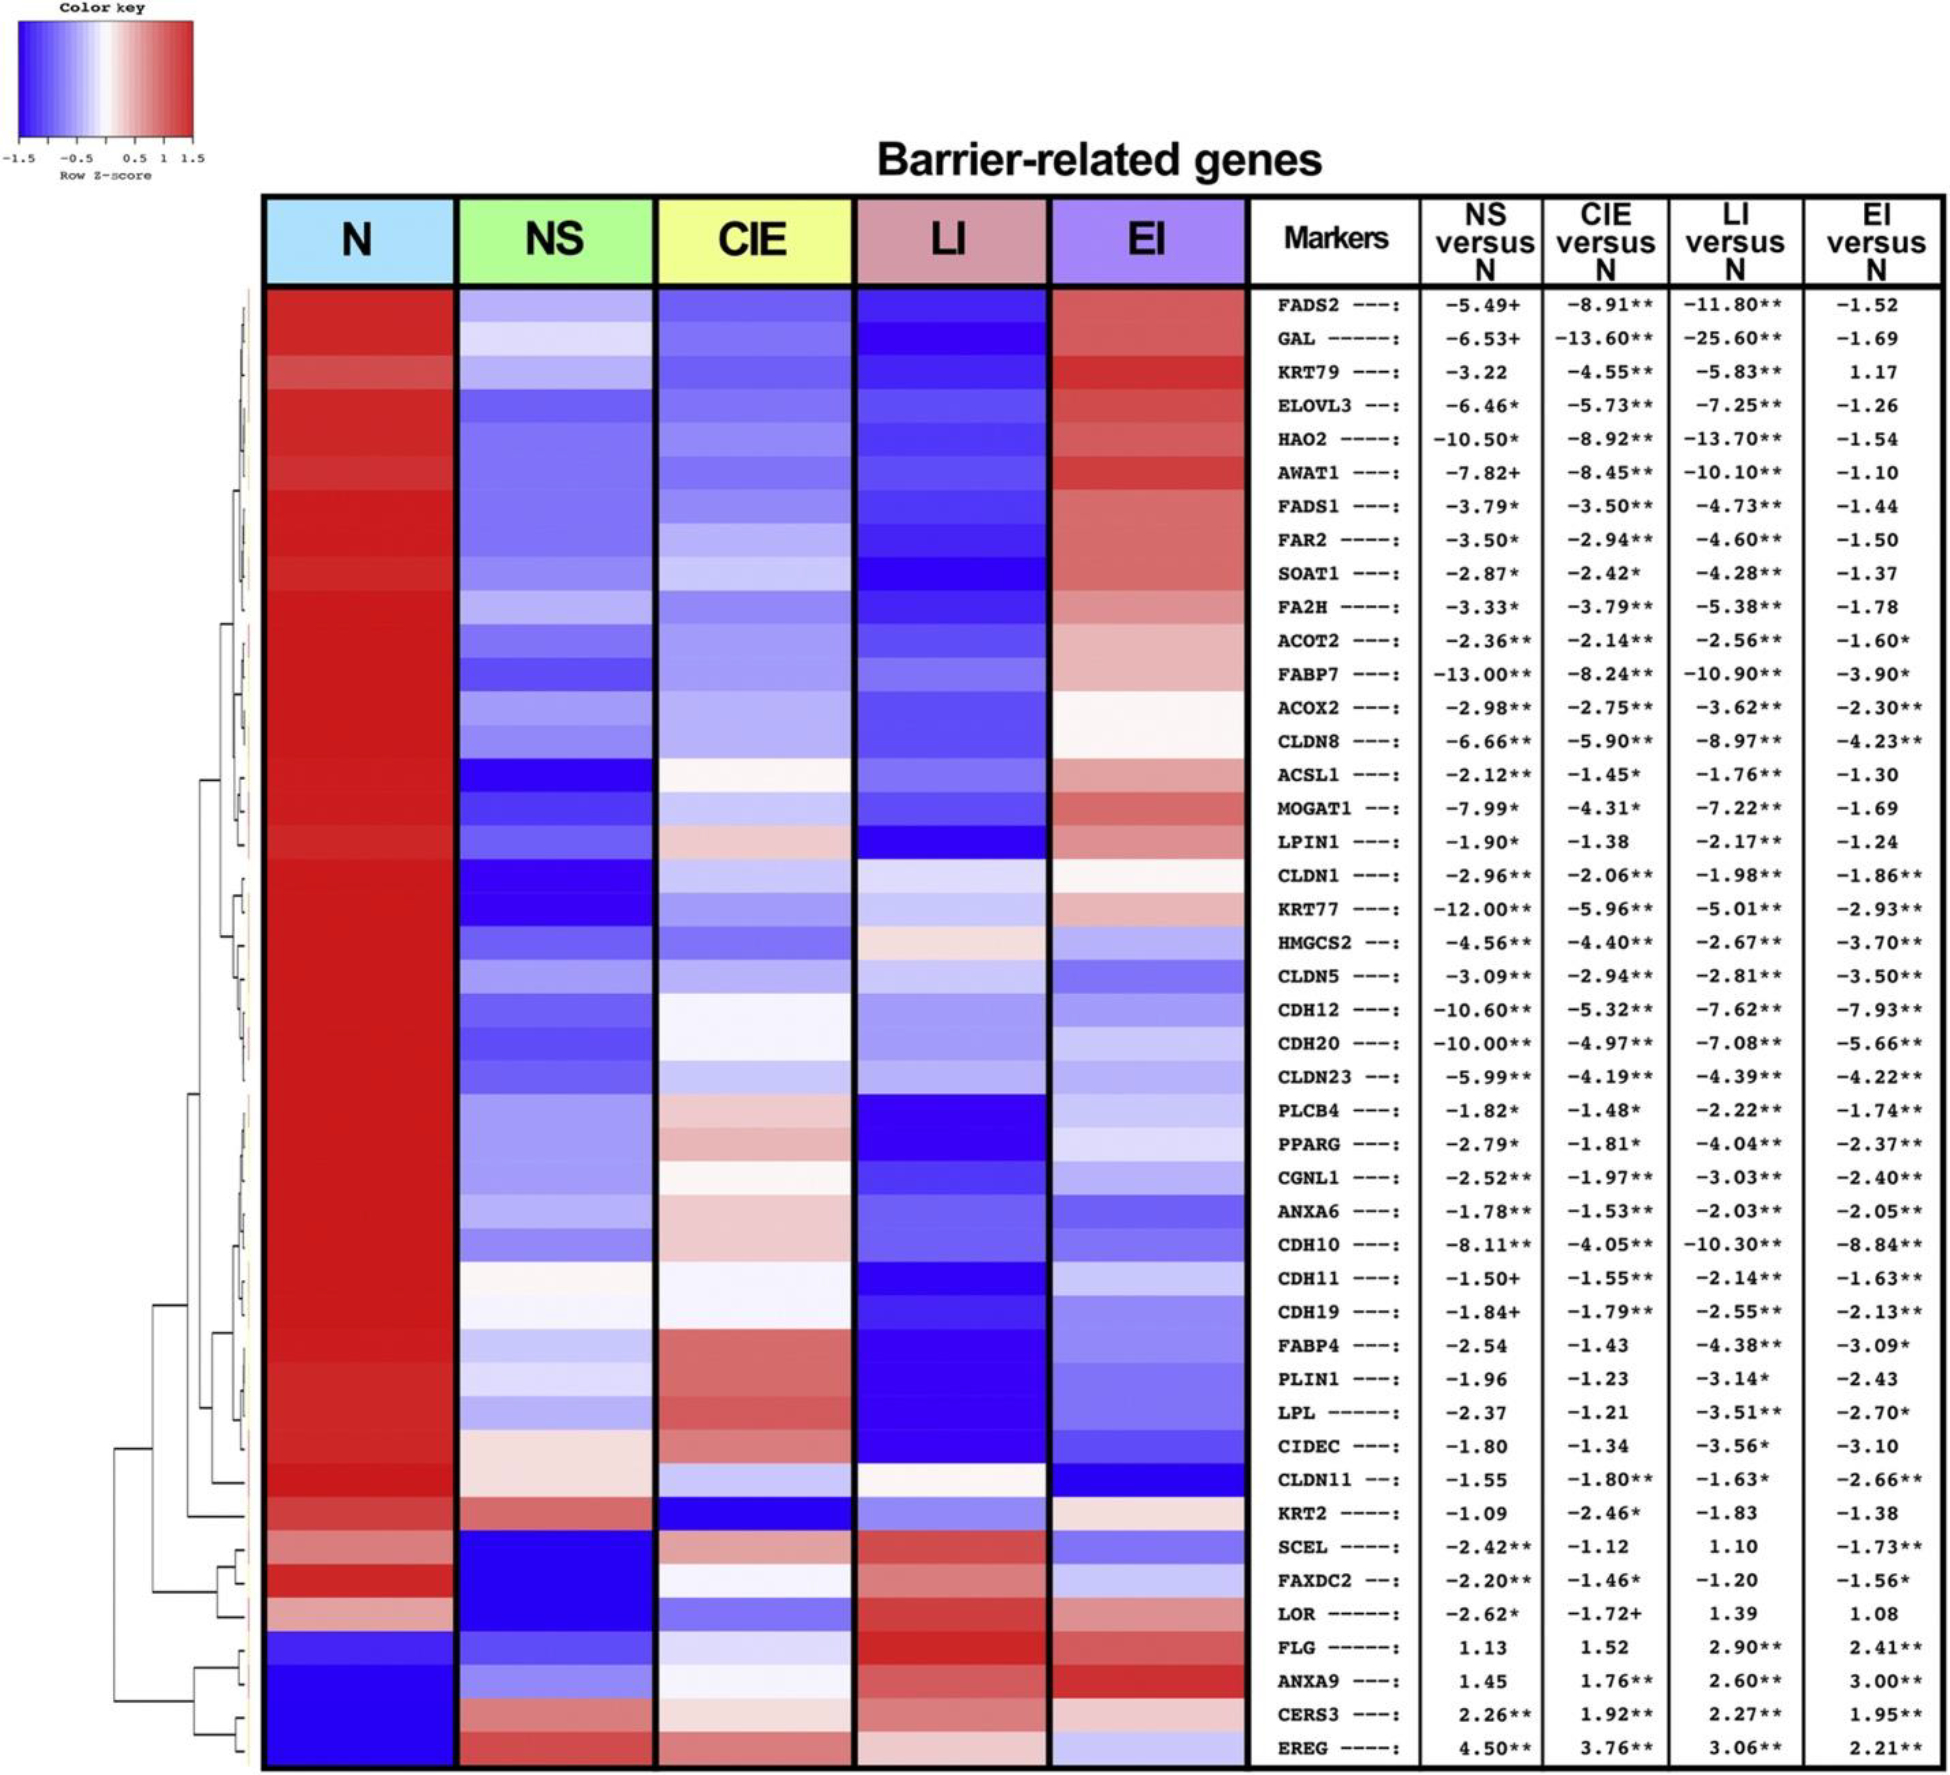
Figure 3. Ichthyosis subtypes share global barrier abnormalities, with EI presenting the least disrupted phenotype.

Heatmap representing differentially expressed barrier-related genes from biopsied skin of patients with the various ichthyosis subtypes and healthy controls. Criteria for differential gene expression include FCH > 2 and FDR < 0.05. From left to right, heatmap columns represent N, NS, CIE, LI, and EI. The table shows FCHs in NS versus N, CIE versus N, LI versus N, and EI versus N. N denotes normal. ∗∗FDR < 0.01, ∗FDR < 0.05, and +FDR < 0.1. CIE, congenital ichthyosiform erythroderma; EI, epidermolytic ichthyosis; FCH, fold change; FDR, false discovery rate; LI, lamellar ichthyosis; NS, Netherton syndrome.
