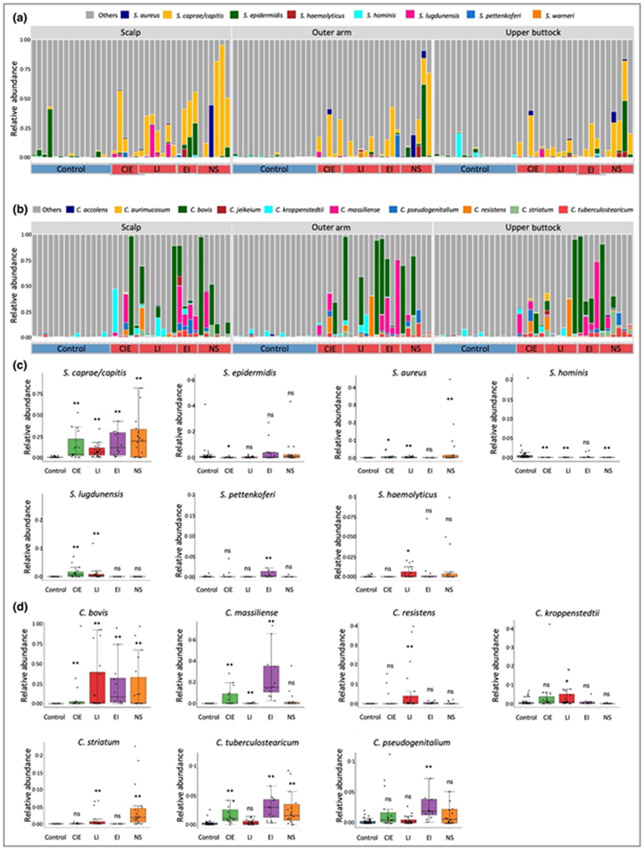
Figure 3.
Stacked bar plots showing relative abundance of (a) Staphylococcus and (B) Corynebacterium spp. (P < 0·05) present in the healthy control and the congenital ichthyosis skin microbiome and grouped by body site. Healthy controls are labelled on the x-axis as control in the blue box and participants with ichthyosis are grouped according to disease subtype [congenital ichthyosiform erythroderma (CIE); lamellar ichthyosis (LI); epidermolytic ichthyosis (EI) and Netherton syndrome (NS)]. Box plots showing significant changes in relative abundance of (c) Staphylococcus and (d) Corynebacterium spp. In the ichthyosis subtypes in comparison with the healthy control group. Statistical significance was determined using the permutation test on the Wilcoxon rank sum test statistic with multiple testing correction using familywise error rate as described in Appendix S1 (see Supporting Information) (*P < 0·05; **P < 0·01) was computed for (c) and (d). ns, not significant.

