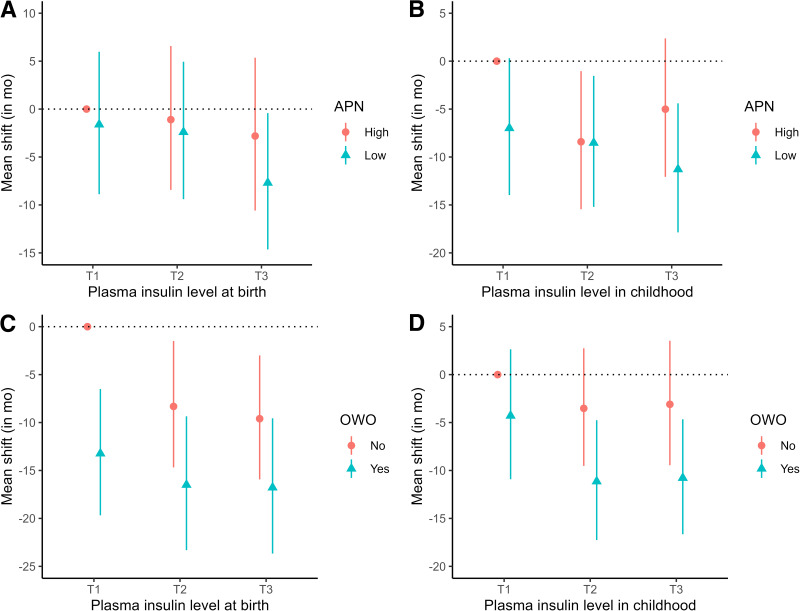
Figure 1.
Combined associations of plasma insulin, OWO, and childhood adiponectin with age at menarche. A and B display the combined associations of early childhood adiponectin and plasma insulin at birth (A) and in childhood (B) with age at menarche. The y axis represents the mean shift of age at menarche (in months). C and D display the combined associations of childhood OWO and plasma insulin at birth (C) and in childhood (D) with age at menarche. The y axis represents the mean shift of age at menarche (in months). Low adiponectin was defined as plasma adiponectin concentrations in childhood below median, while high adiponectin was defined as above median. APN, adiponectin; mo, months; T, tertile.

