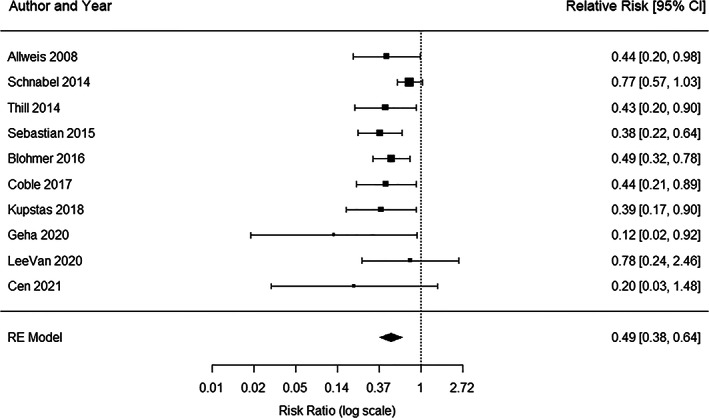
FIGURE 2.

Forest plot results of all 10 studies used in meta‐analysis. Each black square represents the relative risk of having re‐excision, as calculated for each study and listed in the column “Relative Risk” on the right.The horizontal lines to the left and right of each square represent the lower and upper confidence limits, and the actual values are listed on the right. The pooled risk ratio is represented in the bottom row with black diamond. The left and right points of the diamond indicate the confidence limits.
