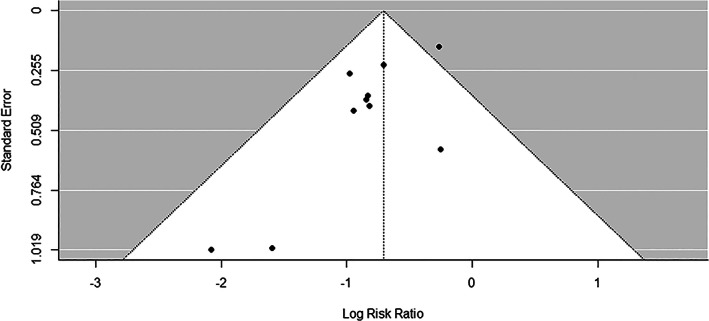
FIGURE 3.

Funnel plot results of all 10 studies used in meta‐analysis. Each dot represents a study. The y‐axis is the standard error of the effect estimate. Larger studies with higher power are placed towards the top. Lower powered studies are placed towards the bottom. The x‐axis shows the risk ratio for the study. The plot should ideally resemble a pyramid funnel, with scatter due to sampling variation. The shape is expected because the studies have a wide range of standard errors.
