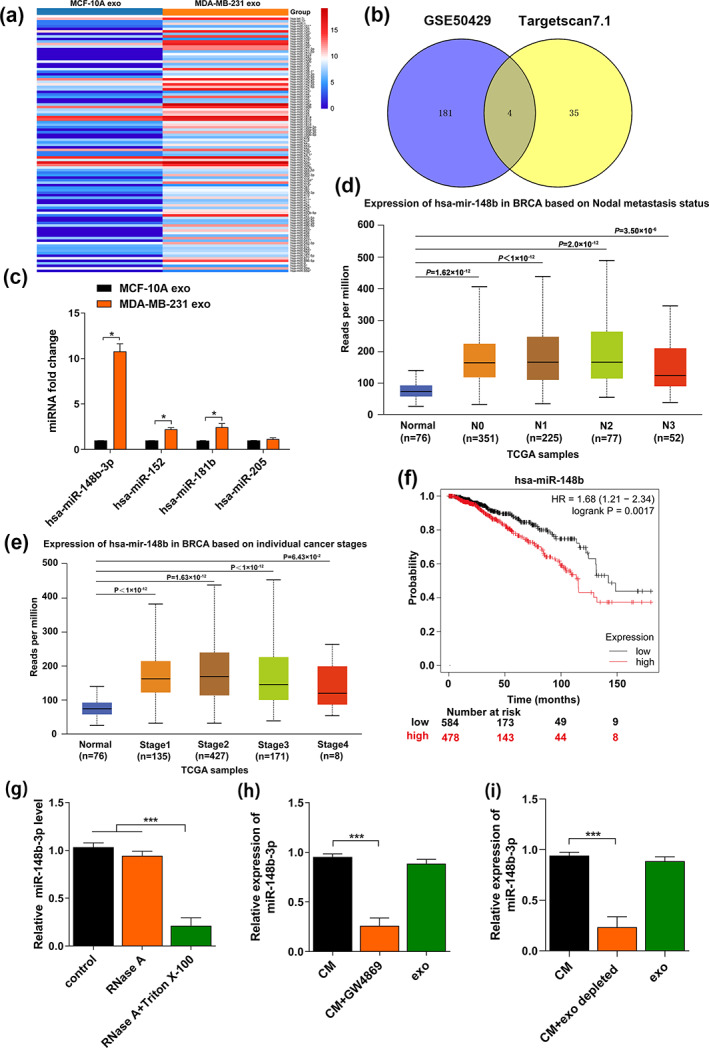
FIGURE 3.

miR‐148b‐3p is upregulated in breast cancer cell‐derived exosomes. (a) Heatmap of differential miRNA expression between MDA‐MB‐231‐exo and MCF‐10A‐exo based on GEO Dataset (GSE50429, FDR corrected p‐value <0.05). (b) Venn diagram of upregulated miRNAs from GSE50429 and the target miRNAs of TSC2 predicted by Targetscan 7.1 software, which was calculated using Venny 2.1 software. (c) Expression levels of four potential upregulated miRNAs in exosomes derived from MDA‐MB‐231 were evaluated by qRT‐PCR. (d, e) Correlations between miR‐148b‐3p expression levels and lymph node metastasis and tumor stage in primary BRCA samples based on TCGA dataset from UALCAN. (f) The Kaplan–Meier survival curves of BC patients are shown according to the expression levels of serum exosomal miR‐148b‐3p (p = 0.0017 by log‐rank analysis). (g) qRT‐PCR was utilized to evaluate the miR‐148b‐3p expression in the conditioned medium of MDA‐MB‐231 cells pretreated with control medium or RNase A (2 mg/mL) alone or in combination with Triton X‐100 (0.1%) for 0.5 h. (h, i) qRT‐PCR was utilized to detect miR‐148b‐3p expression in the conditioned medium of MDA‐MB‐231 cells pretreated with GW4869 or depleted exosomes by ultracentrifugation. The Student's t‐test was adopted to analyze the statistical significance of the difference between two groups, and one‐way ANOVA test was utilized to analyze multiple groups (*p < 0.05, **p < 0.01, ***p < 0.001).
