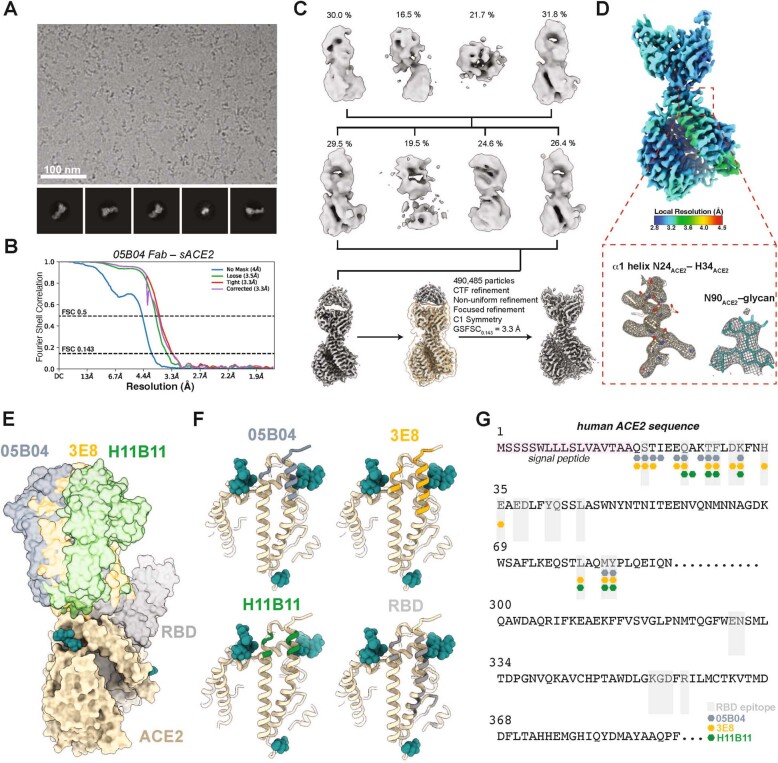
Extended Data Fig. 5. Cryo-EM data processing, validation, and structure comparison.
(A) Representative micrograph of 4,907 used and 2D class averages for 05B04-hACE2 data collection. (B) Gold-standard FSC plot calculated in cryoSPARC for local refinement. (C) 3D classification and refinement logic tree for the 05B04-hACE2 cryo-EM data set. (D) Local resolution estimate for 05B04-hACE2 locally refined map and representative cryo-EM density contoured at 7σ for boxed regions. (E) Structural superposition of anti-hACE2 mAbs 05B04 (slate blue), 3E8 (orange), h11B11 (green) and SARS-CoV-2 RBD (gray) modeled on soluble ACE2 (wheat). (F, G) Comparison of anti-hACE2 mAb epitopes visualized on an ACE2 model (F) or highlighted on the ACE2 sequence (G). anti-hACE2 mAb epitopes are colored slate blue, orange, and green for 05B04, 3E8, and h11B11, respectively. The SARS-CoV-2 RBD epitope is denoted as shaded gray boxes (G).

