
Extended Data Fig. 6. Internalization of a control anti-CD44 antibody in A549/hACE2-HA cells.
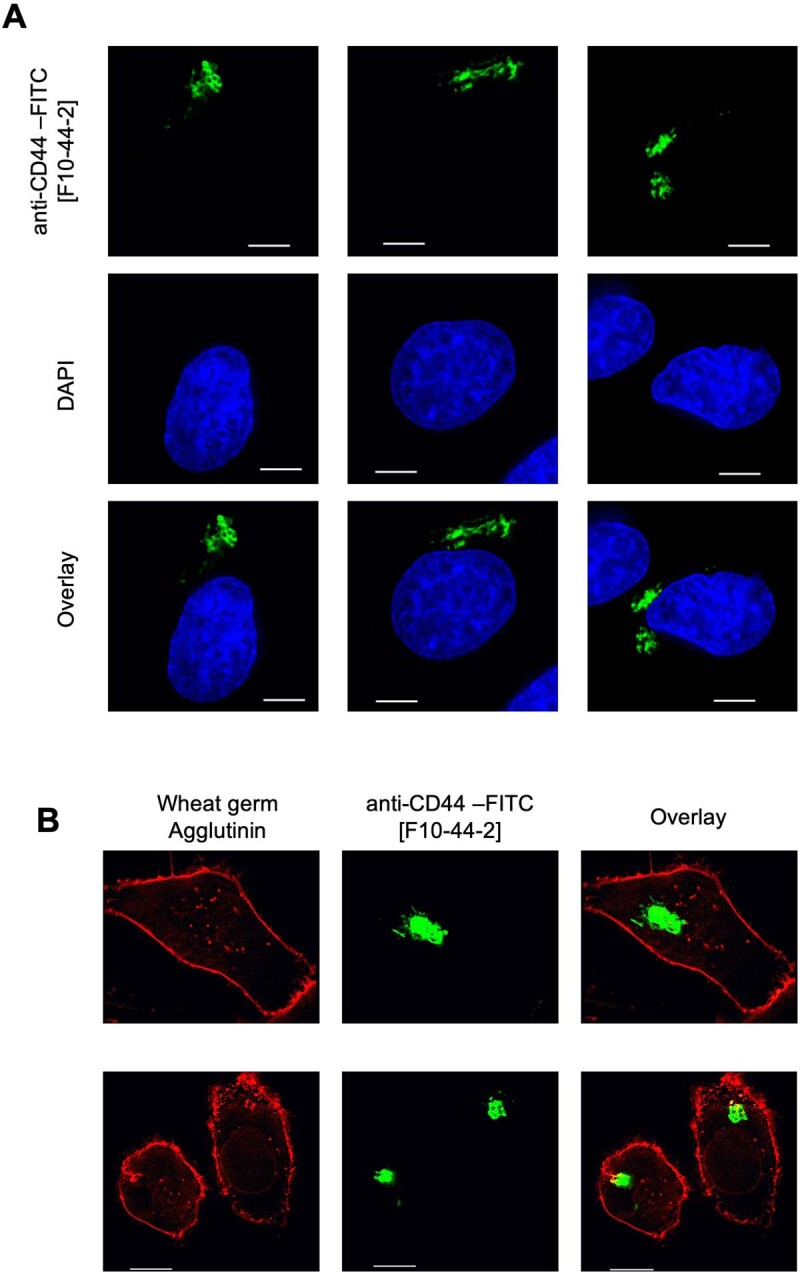
(A, B) Localization of anti-CD44 antibody (green, upper panels) following incubation of live A549/hACE2-HA cells with FITC-labelled anti-CD44 [F10-44-2]. Blue stain (DAPI) indicates cell nuclei in panel (A) where three representative fields are shown. Red indicates staining of cell surface with Wheat Germ agglutinin conjugated with Alexa Fluor™ 594 in panel B where two representative fields are shown. Scale bar: 10 μm. Representative of two experiments.