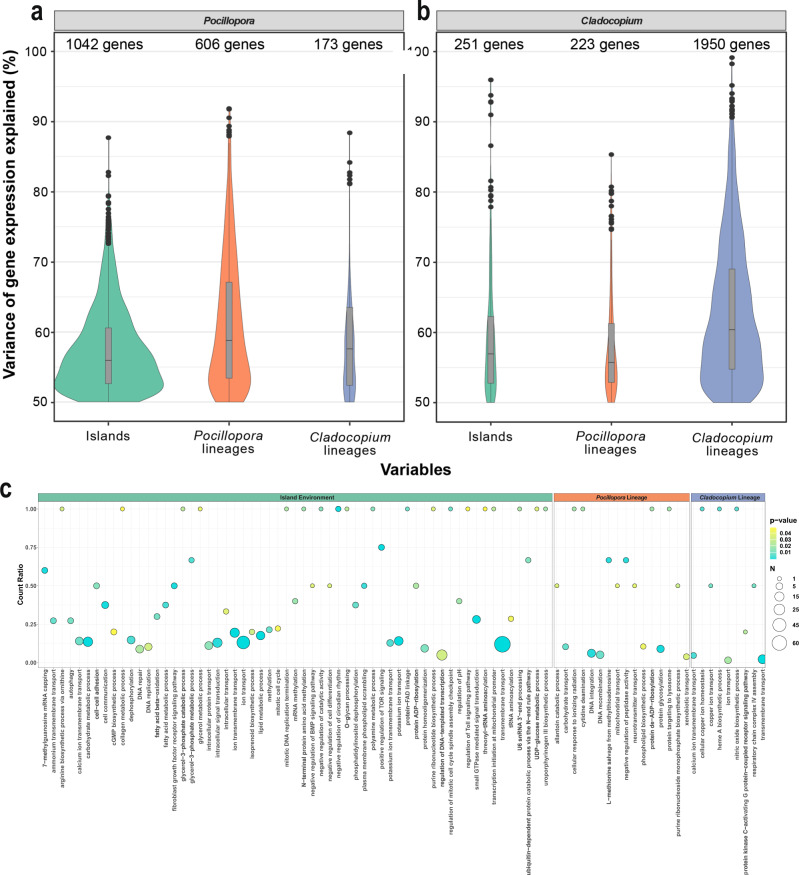
Fig. 3. Contribution of environmental and genetic variables to Pocillopora and Cladocopium gene expression and functional enrichments of top variant genes.
a, b Distribution of genes for which more than 50% of expression variation is explained by one of three predictor variables: sampled island, Pocillopora genetic lineage, and Cladocopium lineage. a Gene expression of Pocillopora across 101 samples (the hybrid colony was excluded). b Gene expression of Cladocopium across 70 samples. Samples of mixed lineage, from Rapa Nui island, and those containing Durusdinium were excluded. The number of genes in each distribution is indicated above each violin plot. Boxplots within violins display group medians (horizontal dark bar), interquartile range (bounds of box) and the minimum and maximum values (whiskers). Potential outliers are denoted as solid dots. c Gene Ontology enrichment analysis dot plots showing the top enriched biological process GO terms identified for each gene from comparison to a Wallenius noncentral hypergeometric sampling distribution allowing for P value calculation after accounting for selection bias and correction for multiple testing (FDR ≤ 0.05) using GOSeq (v1.40.0). Pocillopora genes with the highest explained variance under the island of sampling (left panel), host genetic lineage (middle panel), and photosymbiont lineage (right panel) variables are indicated. The x axis position and size of each dot reflects the proportion and absolute number of enriched genes (N) sharing that GO term, respectively, and the color of the dot indicates the enrichment significance. Source data are provided as a Source Data file.

