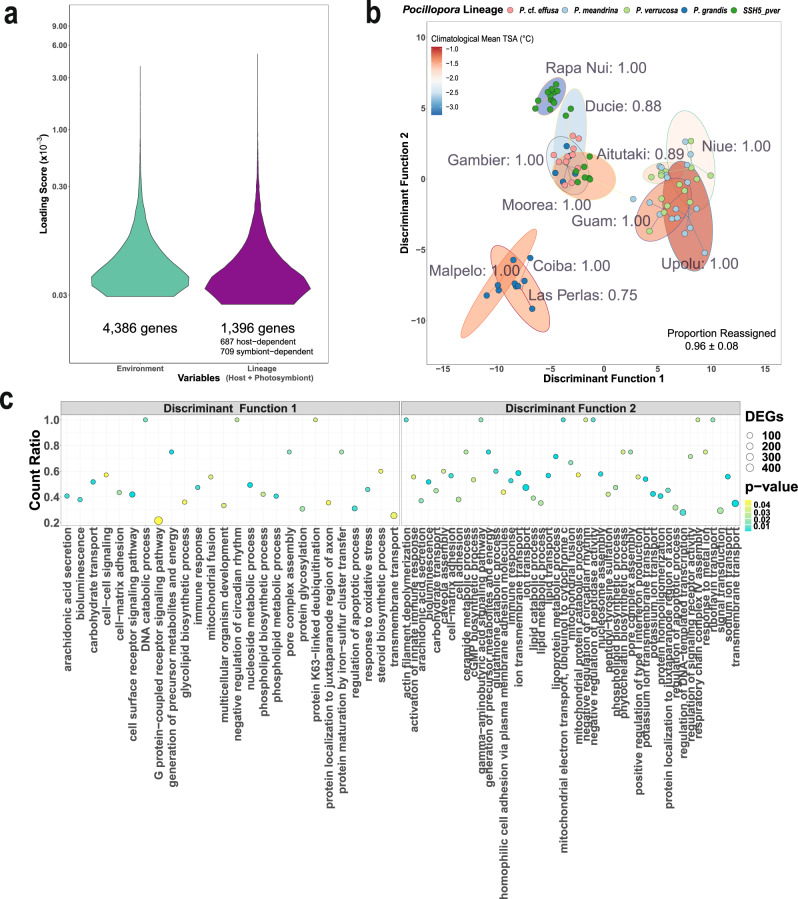
Fig. 4. Discriminant analysis of principal components (DAPC) of Pocillopora host gene expression data grouped by the environment and biological process functional enrichments of top discriminant genes.
a Loading scores of top discriminant genes revealed a roughly equivalent influence of the environment and of genetic lineage on gene expression in the Pocillopora host, but with a greater number of genes associated with the environment. b DAPC scatter plot showing expression profiles for the Pocillopora host when colonies were grouped by the environment. Points represent individual colony expression profiles and are colored by genetic lineage. Shaded ellipses denote 95%-confidence intervals around the group (island) mean and are colored by climatological mean thermal stress anomalies (TSA, 2002— sampling date). Group-specific proportions of correct reassignments are indicated within each cluster (labels) and the overall model proportion of correct reassignment (mean ± standard deviation) is presented in the bottom right. c Gene Ontology enrichment analysis dot plots showing the top enriched biological process GO terms identified for each gene from comparison to a Wallenius noncentral hypergeometric sampling distribution allowing for P value calculation after accounting for selection bias and correction for multiple testing (FDR ≤ 0.05) using GOSeq (v1.40.0). Data are shown for Pocillopora host genes contributing most strongly to the first (left panel) and second (right panel) discriminant function. The x axis position and size of each dot reflects the proportion and absolute number of enriched genes (DEGs) sharing that GO term, respectively, and the color of the dot indicates the enrichment significance. Source data are provided as a Source Data file.

