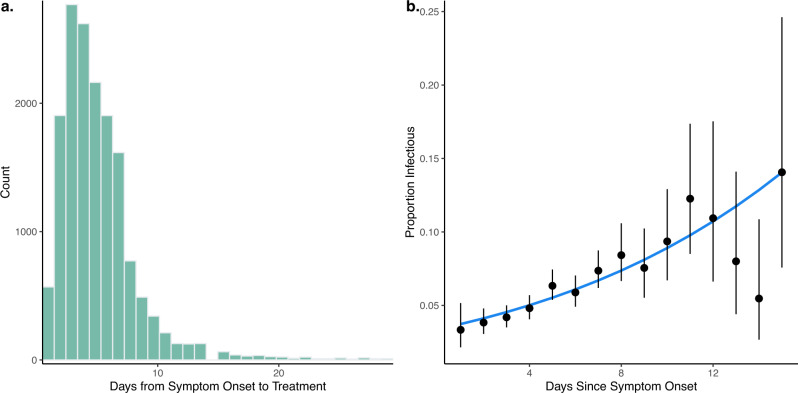
Fig. 3. Duration of infectiousness from surveillance data.
The time of infectiousness was calculated from a time between symptom onset and treatment for P. knowlesi cases and b proportion and 95% CI of clinical P. knowlesi cases having microscopically observed gametocytes on presentation to health facility. Data are presented as the observed proportion of cases with microscopically observed gametocytes from 16,765 clinical P. knowlesi cases with the error bars representing 95% confidence intervals, the line is predicted probability; see Supplementary Fig. 3.

