Figure 2.
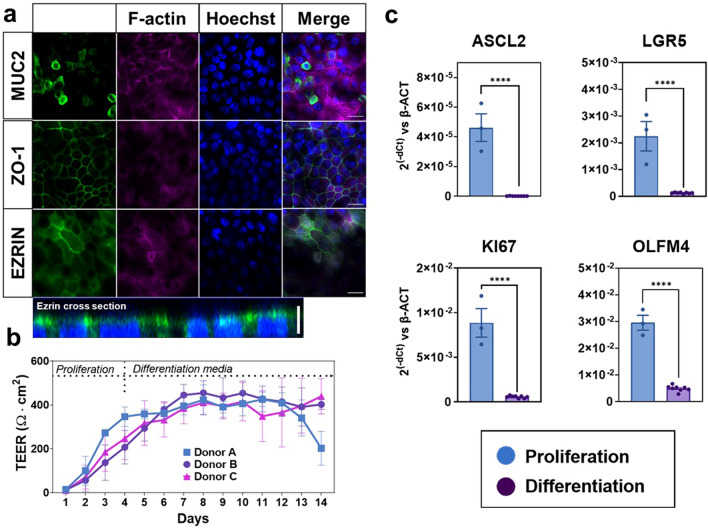
Mature and differentiated colon micro-tissues were consistently generated in microfluidic devices. (a) Representative images of colon micro-tissues that were fixed, stained and imaged within devices. Anti-MUC2 (mucus proteins), anti-ZO-1 (organized tight junction at cell borders), and anti-Ezrin (brush border at the apical surface of the tissue) were stained in green. All devices were co-stained with fluorescently labeled phalloidin to identify f-actin cytoskeletal protein (pink) and Hoechst 33342 to identify nuclei (blue). White scale bars represent 20 microns. Images are representative of data collected from 3 independent experiments. (b) Micro-tissue barrier function and health was monitored longitudinally by measuring TEER in micro-cultures derived from 3 different colon donors over 14 days. TEER data are representative of data collected from 3 independent experiments. (c) Differentiation was also monitored by changes in gene expression of key stem cell and proliferation markers (ASCL2, LGR5, KI67, OLFM4) cultured in DM compared to micro-tissues cultured in PM. Quantitative RT-PCR measurement of gene expression is reported as relative to expression of the housekeeping gene β-ACTIN for each sample. In all cases, error bars represent standard error of the mean. A two-tailed unpaired t-test was used to analyze tissues grown in PM versus DM with an α = 0.05 (* p < 0.05, ** p < 0.01, *** p < 0.005, **** p < 0.0001). N = 3 (IF imaging), N = 3–8 (PCR), N = 10 (TEER).

