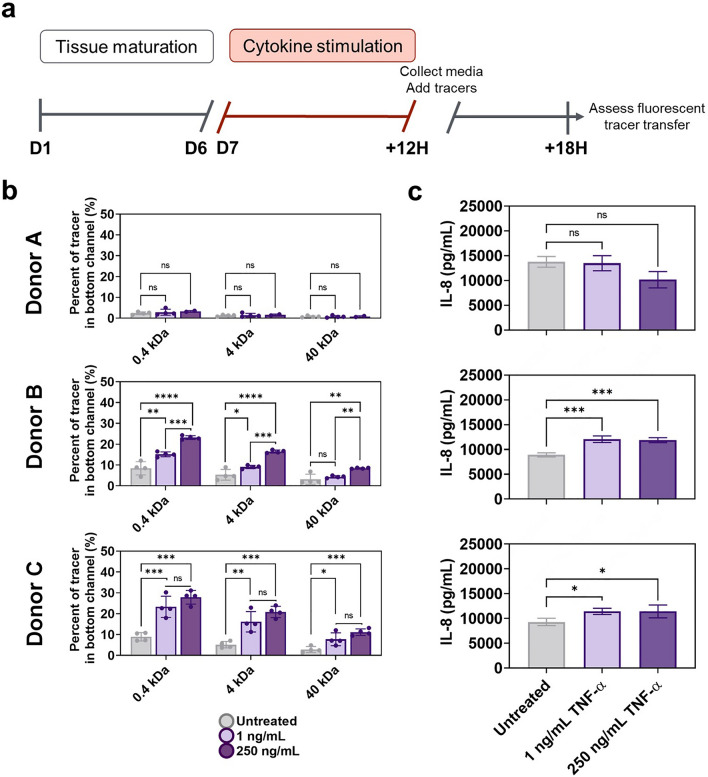
Figure 4.
TNF-α dosing impacts colon micro-tissue permeability and IL-8 secretion (a) Colon tissues were generated in devices through 4 days culture in PM followed by 3 days in DM. Established colon micro-tissues (verified by high TEER) were exposed for 12 h to TNF-α doses and then replaced with the tracer dye molecules under recirculation. (b) Permeability was assayed as fluorescent tracer transfer from top to bottom channel after 6 h. Values are displayed as percent of tracer in bottom channel to quantify probe transfer across the epithelial barrier of micro-tissues derived from 3 colon donors. Results of 0.4 kDa lucifer yellow (LY), 4 kDa FITC-dextran and 40 kDa TRITC-dextran transfer are shown for high and low doses of TNF-α compared to untreated controls. All error bars represent standard error of the mean. A one-way ANOVA with α = 0.05 was utilized to compare dose responses within a group unique to each donor, cytokine dose curve, and tracer. Post hoc analyses were performed with Tukey’s multiple comparisons test after ANOVA. (ns not significant, * p < 0.05, ** p < 0.01, *** p < 0.005, **** p < 0.0001. N = 4). (c) Following damage to colon micro-tissues, media was collected from microfluidic chambers and IL-8 was measured using a commercial ELISA assay kit. All error bars represent standard error of the mean. A one-way ANOVA was performed with an α = 0.05 and Dunnett’s multiple comparisons test was used to compare cytokine stimulation conditions to the untreated control for each donor. (ns not significant, * p < 0.05, ** p < 0.01, *** p < 0.005, **** p < 0.0001. N = 3).

