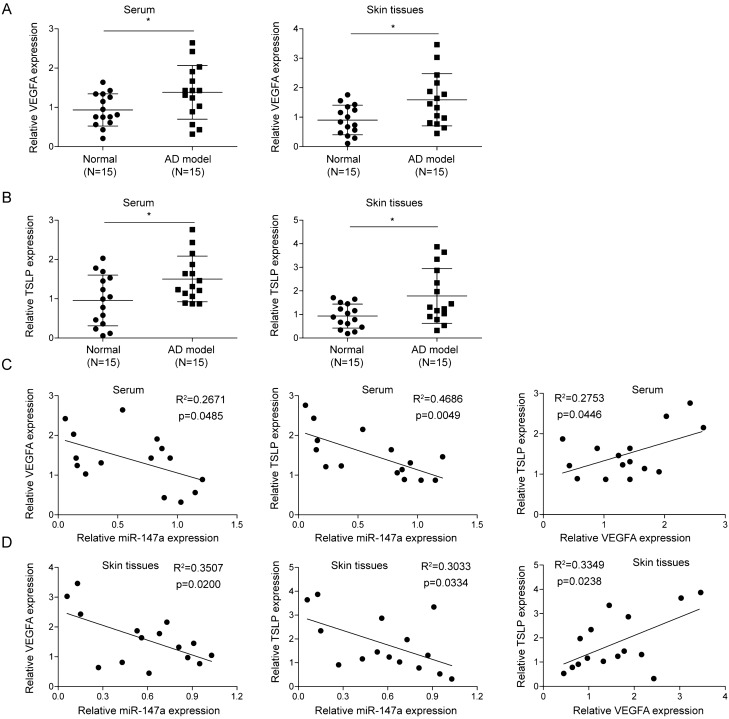
Figure 3.
Correlation of miR-147a among TLSP and VEGFA expression levels in serum and skin tissues of AD mice. (A, B) VEGFA and TSLP expressions in serum and skin samples from AD mice and normal mice were assessed by RT-qPCR. (C, D) Expression correlations of miR-147a, VEGFA and TSLP in serum and skin tissues of AD mice were analyzed by Spearman correlation analysis. Data were expressed as mean ± SD. n = 15. *p < 0.05, **p < 0.01, ***p < 0.001.

