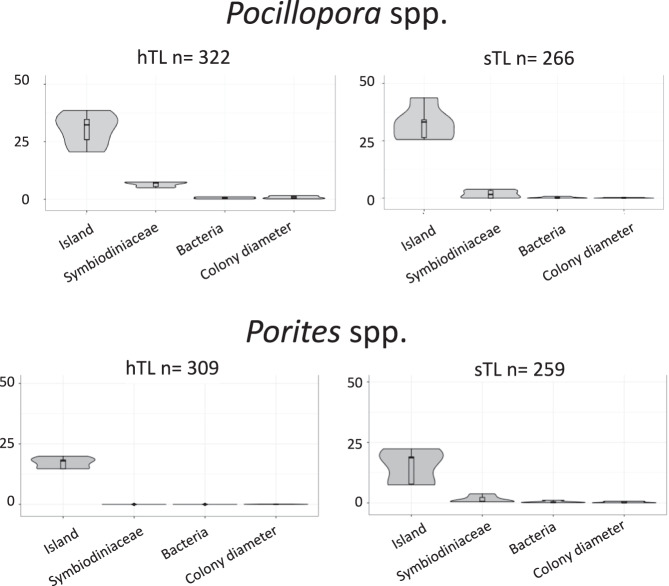
Fig. 2. Telomere DNA length (TL) variation is determined by island.
Percentage of TL variation explained by the island of origin, Symbiodiniaceae and bacterial communities, and colony morphology (diameter) for Pocillopora spp. and Porites spp. colonies across 32 islands of the Pacific Ocean. In this analysis, i.e., mean, median, Q1, Q3 and IQ were used. n refers to the number of samples. The boxplots are defined as follows: the lower and upper bounds of the box represent the first (Q1) and the third (Q3) quartile, respectively. The entire box represents the interquartile range (IQ). The median is represented as a line across the box. Whiskers extending from Q1 and Q3 are defined as 1.5xIQ. Source data are provided as a Source Data file.

