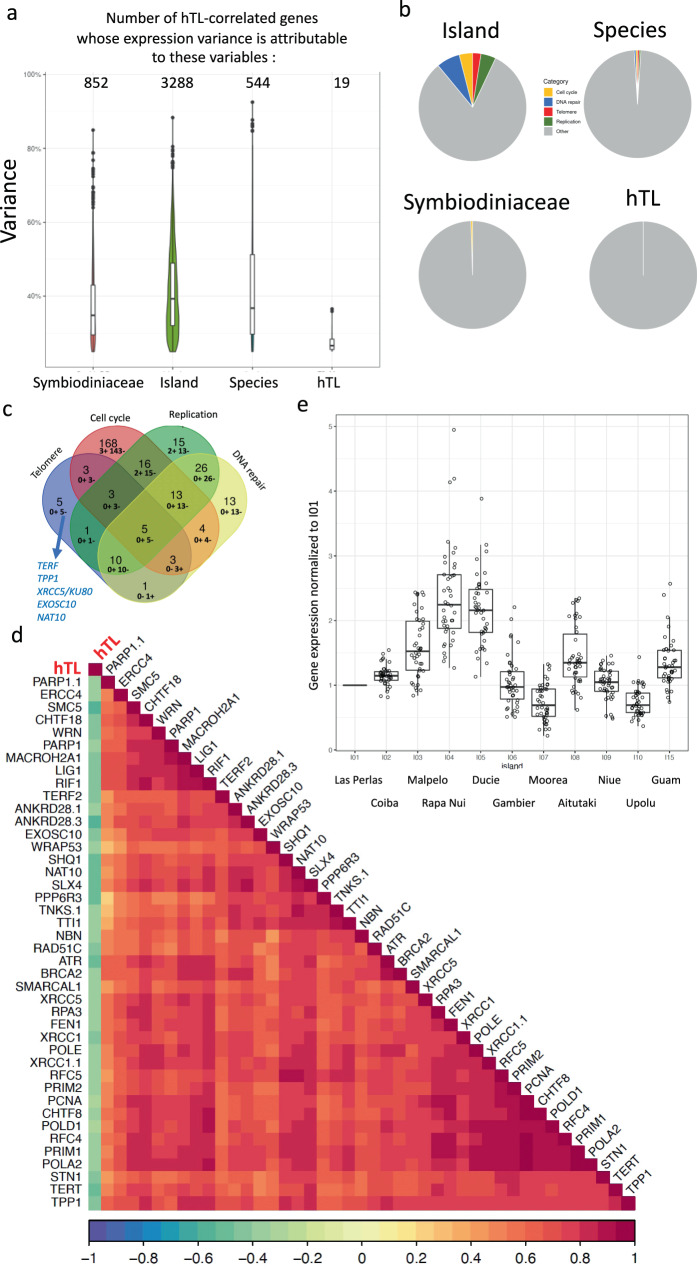
Fig. 4. Negative correlation of coral telomere DNA length and expression of telomere genes in Pocillopora spp.
a Distribution of hTL-correlated genes for which more than 25% of the variation in their expression is explained by one of four predictor variables: the island of origin, the host species (shown as “species”), the Symbiodiniaceae communities and hTL. The number of genes in each distribution is indicated above each violin plot. b Pie-charts representing the proportion of significant (p-value < 0.05, Fisher’s exact test) Biological Process pathways for human homologs. Five categories of pathways are defined: Biological Process pathways associated with the terms telomere, cell cycle, DNA replication and DNA repair determined from the genes whose expression variance is associated with island, Symbiodiniaceae composition, host species and hTL ‘from panel a). The “Other” category gathers the remaining pathways. The full list of Biological Process pathways and the five categories that we defined are shown in Supplementary Data 3. c Venn diagram of the hTL-correlated genes found in the four categories of pathways defined in panel b: telomere, replication, cell cycle and DNA repair. Among them, the number of genes positively and negatively correlated with hTL are indicated as: n+ m– (n genes positively correlated, m genes negatively regulated. The five hTL negatively correlated genes belonging only to the telomere category are indicated: TRF and TPP1 are two subunits of the telomere capping factor shelterin, XRCC5/KU80 is a DNA repair protein involved in telomere maintenance while NAT10 and EXOSC10are two proteins reported to be invoved in telomerase regulation. d Correlogram obtained with Spearman correlation of hTL and the expression of genes belonging to the telomere category (panels b, c); all significantly correlated between each other (p < 0.05). p-values were adjusted by the Benjamini–Hochberg method. e Expression by island of telomere genes selected in panel c. The expression (TPM) of each gene is normalized to the mean expression value of I01 (Las Perlas) (n = 103 samples). The boxplots of a and e are defined as follows: the lower and upper bounds of the box represent the first (Q1) and the third (Q3) quartile, respectively. The entire box represents the interquartile range (IQ). The median is represented as a line across the box. Whiskers extending from Q1 and Q3 are defined as 1.5xIQ. Source data are provided as a Source Data file.

