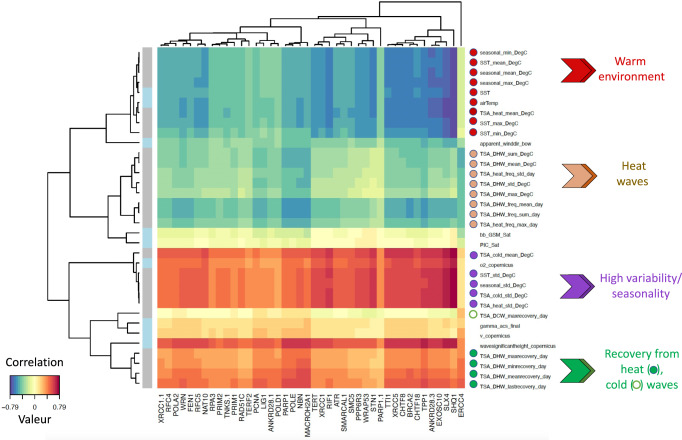
Fig. 5. Relationships between environmental variables and telomere gene expression.
Results of a two-dimensions sparse partial least squares (sPLS) regression of telomere gene expression (measured as TPM) and environmental variables (contextual at the time and sampling and historical as recorded from 2002 to the sampling date). Clustered image map of the two sPLS dimensions, displaying pairwise correlations between genes (bottom) and environmental variables (right). Red and blue indicate positive and negative correlations, respectively. Hierarchical clustering was performed within the mixOmics cim function based on the sPLS regression model. Source data are provided as a Source Data file.

