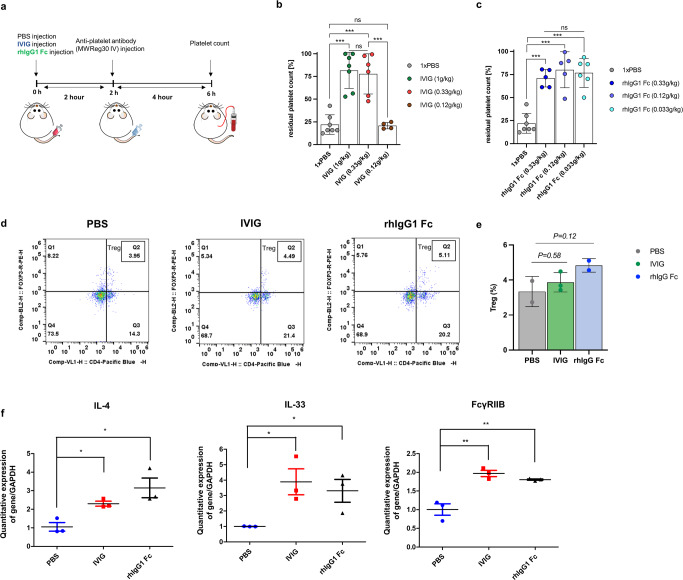
Fig. 5. Use of a passive immunothrombocytopenia (ITP) mouse model to validate the anti-inflammatory activity of rhIgG1 Fc purified from ALB::hIgG1 Fc chickens.
a Schematic illustration of the in vivo experiment using a passive ITP mouse model. Two hours before injection of an anti-platelet antibody MWReg30 (0.1 μg/g), mice received an intraperitoneal injection of IVIG or rhIgG1 Fc. At 4 h post-injection of MWReg30, blood was extracted from the tail vein and platelets were stained by Rees and Ecker diluting fluid and counted under a phase-contrast microscope. b The residual platelet count was quantified at 4 h post-injection of MWReg30, which itself was injected 2 h after IVIG (1 g/kg, 0.33 g/kg, or 0.12 g/kg). Each dot represent individual mice. (n = 4–7 of independent samples). c The residual platelet count was quantified 4 h after injection of MWReg30, which was administered 2 h after hIgG1 Fc (0.33 g/kg, 0.12 g/kg, or 0.033 g/kg). (n = 5-7 of independent samples). d Representative flow cytometry plots demonstrating expansion of the endogenous CD4+/Foxp3+ Treg population in the spleen. Spleens from the PBS, IVIG (1 g/kg), rhIgG1 Fc (0.33 g/kg) treatment groups were analyzed. e Treg population percentages of spleens from the PBS, IVIG (1 g/kg), rhIgG1 Fc (0.33 g/kg) treatment groups after 6 h of treatment analyzed by flow cytometry. Each dot represents individual mice. f Total RNA was isolated from the spleen and used for quantitative real-time PCR to measure IL-4, IL-33, and FcγRIIB mRNA levels. Spleens from the PBS, IVIG (1 g/kg), rhIgG1 Fc (0.33 g/kg) treatment groups were analyzed. (n = 3 of independent samples) Differences among groups were determined by one-way ANOVA and a paired t-test. * P < 0.05, ** P < 0.01, and ***P < 0.001. Error bars represent standard deviation.

