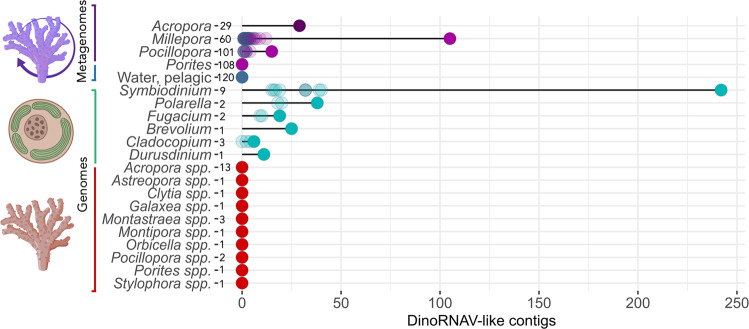
Fig. 2. Quantity of putative endogenized dinoRNAV per metagenome or genome.
Total quantity of putative endogenized dinoRNAV EVEs identified, broadly organized by sample source (metagenome or genome), and number of libraries or assemblies queried (after source name, Supplementary Data 6). Opaque circles denote the sum total of dinoRNAV EVE-like sequences identified from each source, while transparent circles denote individual counts of putative dinoRNAV EVEs per library. Icons created with BioRender.

