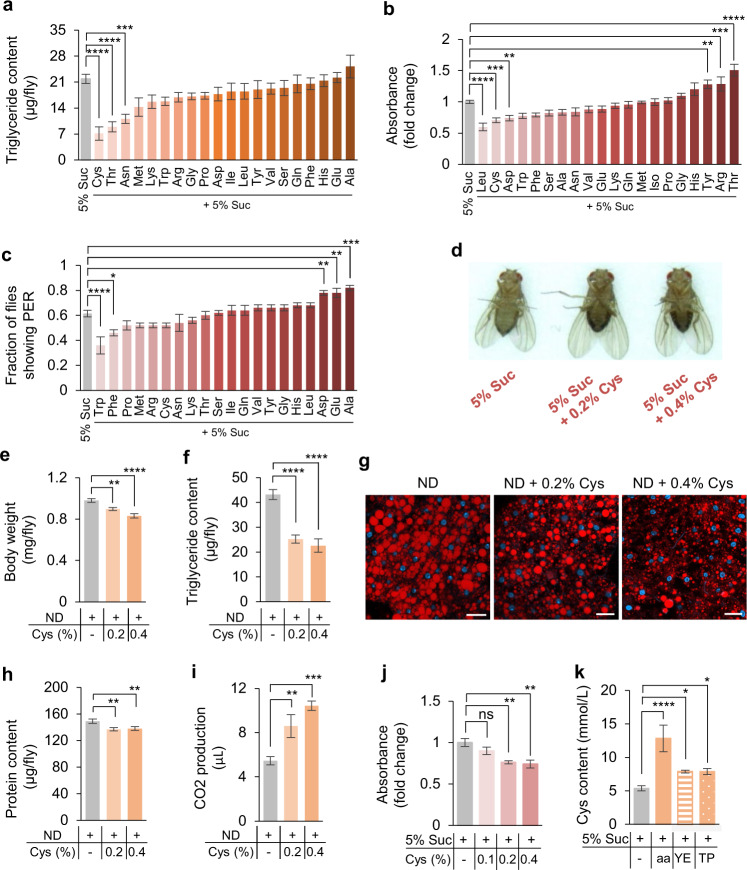
Fig. 2. Dietary cysteine drove weight loss in a dose-dependent manner.
a Triglyceride content of flies fed with 5% sucrose (grey) or 5% sucrose supplemented with 0.2% individual amino acid (orange) for 5 days (n = 5–8). b Food consumption of flies fed with 5% sucrose (grey) or 5% sucrose supplemented with 0.2% individual amino acid (red) for 5 days (n = 5–26). c Fraction of flies showing PER response to 5% sucrose supplemented with individual amino acid (n = 5–7 groups, 10 flies per group). d–i The metabolic effects of dietary cysteine feeding. Representative flies from each treatment group (d). Body weight (e, n = 7–9), triglyceride content (f, n = 8), Nile Red staining of the fat body (g, scale bars, 20 μm), protein content (h, n = 10), and 1 h CO2 production (i, n = 8–14). j Consumption of food containing dietary cysteine by pre-starved flies (n = 6–7). k Hemolymph cysteine levels from flies assayed in Supplementary information, Fig. S1a (n = 8–18). ns, P > 0.05; *P < 0.05; **P < 0.01; ***P < 0.001; ****P < 0.0001. One-way ANOVA followed by post hoc test with Bonferroni correction was used for multiple comparisons when applicable.

