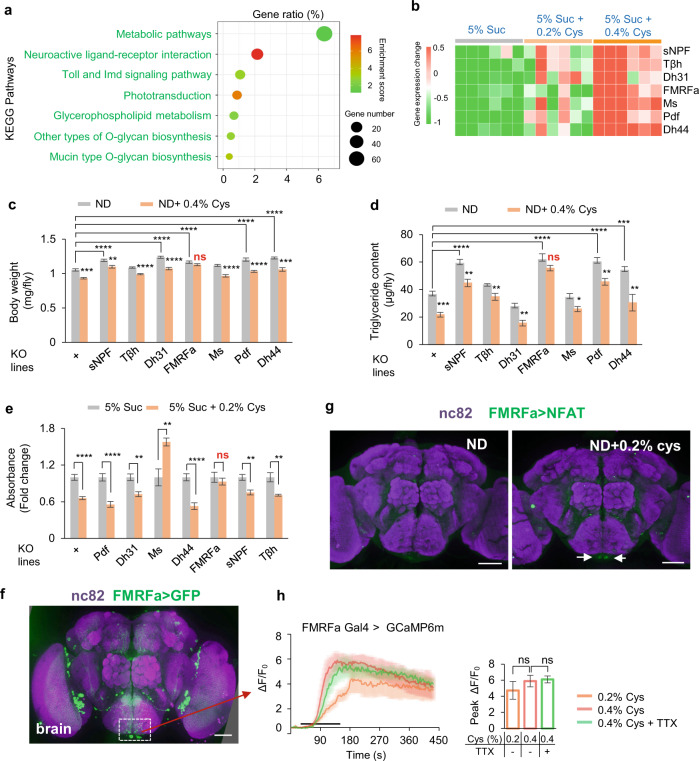
Fig. 3. FMRFa signaling was required for lipid degradation upon dietary cysteine feeding.
a, b RNA-seq analysis of flies fed with 5% sucrose or 5% sucrose supplemented with 0.2% cysteine for 5 days (n = 6). The top influenced signaling pathways by dietary cysteine from KEGG analysis (a). Heatmap of differentially expressed neuropeptide- and neurotransmitter-related genes (FDR < 0.001, fold change > 2). Red and green blocks represented upregulated and downregulated genes by cysteine feeding, respectively (b). c, d Body weight (c, n = 6–7) and triglyceride content (d, n = 6–8) of flies of the indicated genotypes fed with ND or ND supplemented with 0.4% cysteine for 5 days. e Food consumption of flies of the indicated genotypes fed with 5% sucrose or 5% sucrose supplemented with cysteine (n = 5–10). f FMRFa expression in the brain, as illustrated by mCD8::GFP expression driven by FMRFa-GAL4. Scale bar, 50 μm. g The activity of FMRFa+ neurons in the brain after cysteine feeding measured by the NFAT system. Scale bars, 50 μm. h Representative traces and quantification of ex vivo calcium responses of FMRFa+ neurons during the perfusion of cysteine with or without TTX (n = 6). ns, P > 0.05; *P < 0.05; **P < 0.01; ***P < 0.001; ****P < 0.0001. One-way and two-way ANOVA followed by post hoc test with Bonferroni correction were used for multiple comparisons when applicable.

