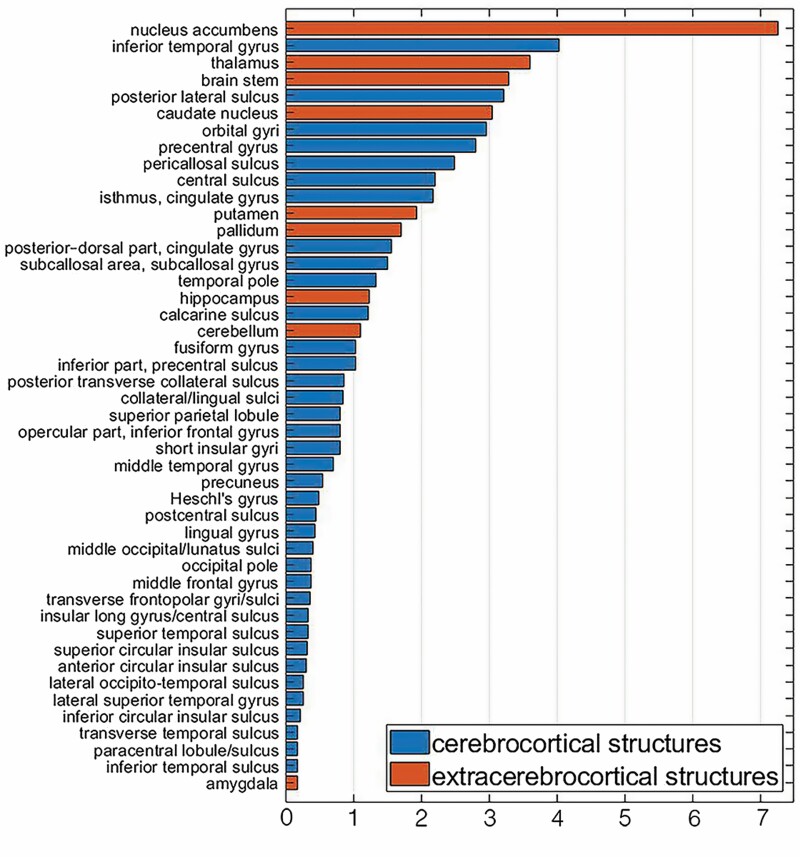
Figure 1.
Adjusted coefficients of coefficient of partial determination for the 46 structures with the largest values included in the sex-agnostic ridge regression model estimating age using regional volumes. Plotted are adjusted values, expressed as percentages of the total variance explained by the full model that includes all predictors (regions or structures). Cortical structures are plotted in darker hues (blue online); extra-cerebral structures, including the subcortex, cerebellum, and brainstem, are plotted in lighter hues (orange online).

