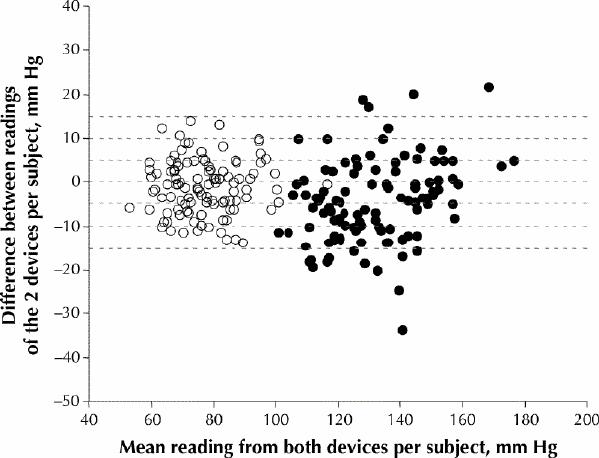
Fig. 1: Agreement in blood pressure readings from 108 volunteers between a sphygmomanometer and the Vita-Stat 90550 automated device in a community setting, as determined using the Bland–Altman method.12,13 For each subject, the difference between the readings of the 2 devices is plotted against the mean of the readings from both devices. Horizontal dashed lines represent readings that differ from –15 mm Hg to 15 mm Hg, in increments of 5 mm Hg. White circles = diastolic pressure, black circles = systolic pressure.
