Figure 4.
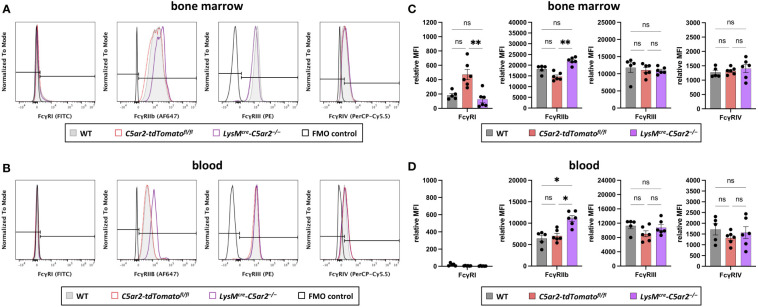
Fcγ receptor expression on BM and blood neutrophils. Histogram overlays of surface expression of FcγRs (FcγRI, FcγRIIb, FcγRIII, FcγRIV) on neutrophils from (A) BM and (B) blood of WT, C5ar2-tdTomatofl/fl , and LysMcre-C5ar2–/– mice. The signal corresponding to the FMO control is shown in black. Relative gMFI of FcγRs corresponding to surface expression on (C) BM and (D) blood neutrophils of WT, C5ar2-tdTomatofl/fl , and LysMcre-C5ar2–/– mice. * p < 0.05, ** p < 0.01; ns, not significant.

