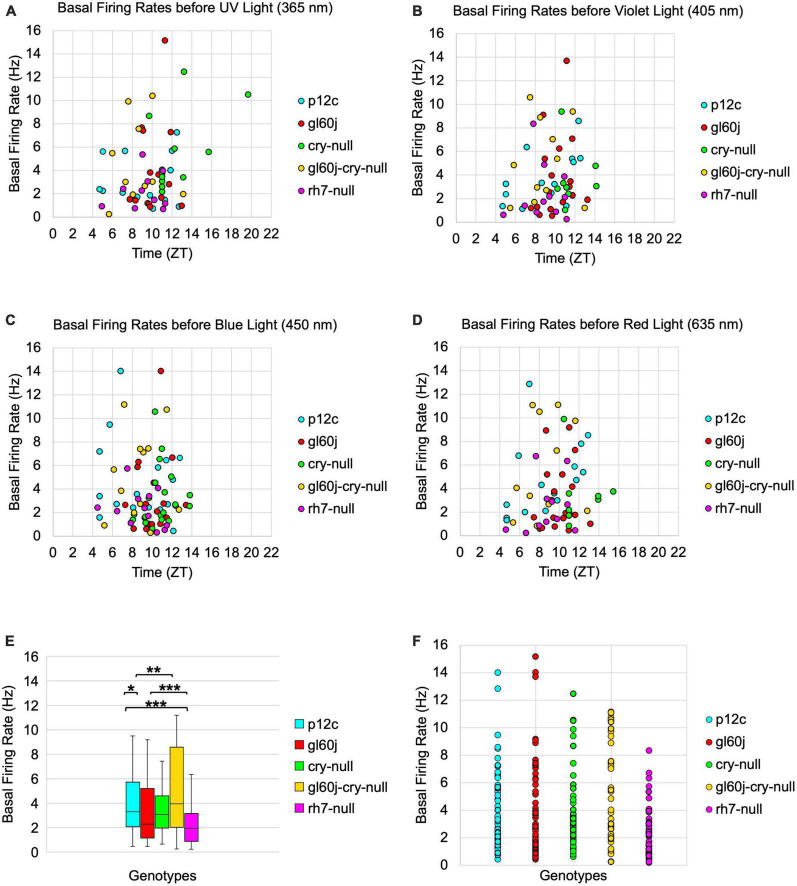
FIGURE 10.
Basal firing rates are not equivalent across groups and there is no time-of-day dependent effect. Average basal firing rates of p12c (blue), gl60j (red), cry-null (green), gl60j-cry-null (yellow), and rh7-null (violet) before (A) UV, (B) violet, (C) blue, and (D) red light stimulus plotted against the relative time-of-day of each recording. (E) Box-and-whisker plot summary of the average basal firing rate for p12c [(n = 35) total, n (ZT0-12) = 30; n (ZT12-16) = 5], gl60j [(n = 22) total, n (ZT0-12) = 20; n (ZT12-16) = 2], cry-null [(n = 26) total, n (ZT0-12) = 14; n (ZT12-16) = 12], gl60j-cry-null [(n = 30) total, n (ZT0-12) = 22; n (ZT12-16) = 8], and rh7-null [(n = 30) total, n (ZT0-12) = 22; n (ZT12-16) = 8]. Median values are denoted by a solid black line within each box of the plot. (F) Individual data points for each genotype for all time points, showing the distribution of the data. Black *indicates FDR adjusted two-sample t-test p ≤ 0.01 vs. p12c. Data are represented as a range of means in a sample set ± maximum and minimum values within the set. One significance symbol, p ≤ 0.1; two significance symbols, p ≤ 0.05; three significance symbols, p ≤ 0.01.

