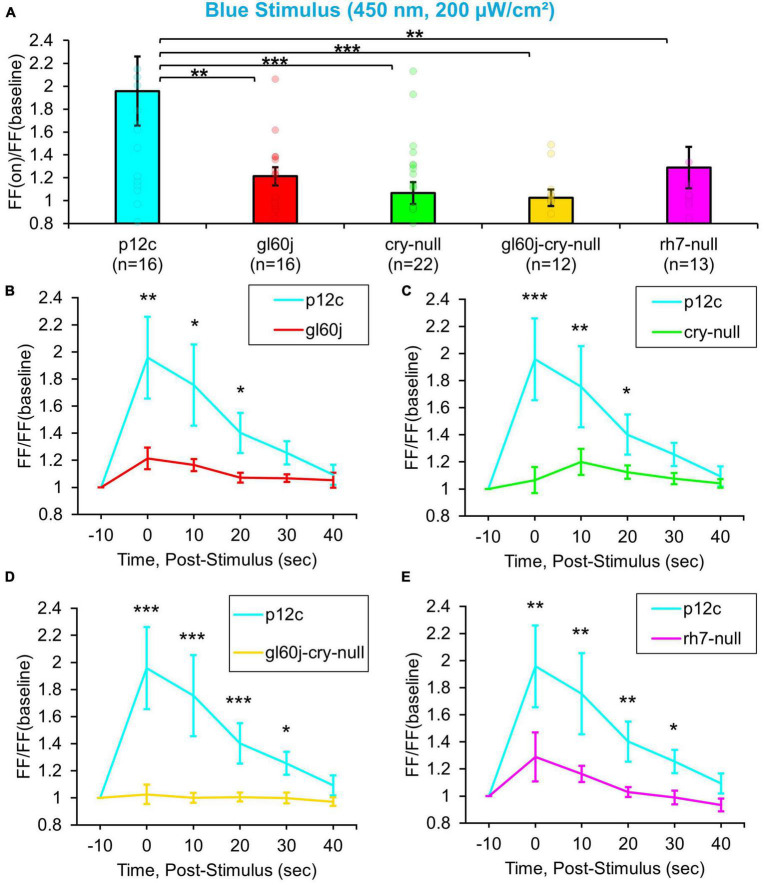
FIGURE 3.
All photoreceptor mutants show an attenuated blue light firing frequency (FF) compared to native expressed Drosophila CRY. (A) Firing frequency response of p12c (blue column, n = 16) versus gl60j (red column, n = 16), cry-null (green column, n = 22), gl60j-cry-null (yellow column, n = 12), and rh7-null (violet column, n = 13) with 5 s blue (450 nm, 200 μW/cm2) light stimulus. Post-stimulus FF response in 10 min bins for (B) p12c (blue trace) vs. gl60j (red trace), (C) p12c vs. cry-null (green trace), (D) p12c vs. gl60j-cry-null (yellow trace), and (E) p12c vs. rh7-null (violet trace). Data are plotted as average ± SEM. Pairwise comparison was analyzed using two-sample t-test with FDR adjustment. *p < 0.1, **p < 0.05, ***p < 0.01.

