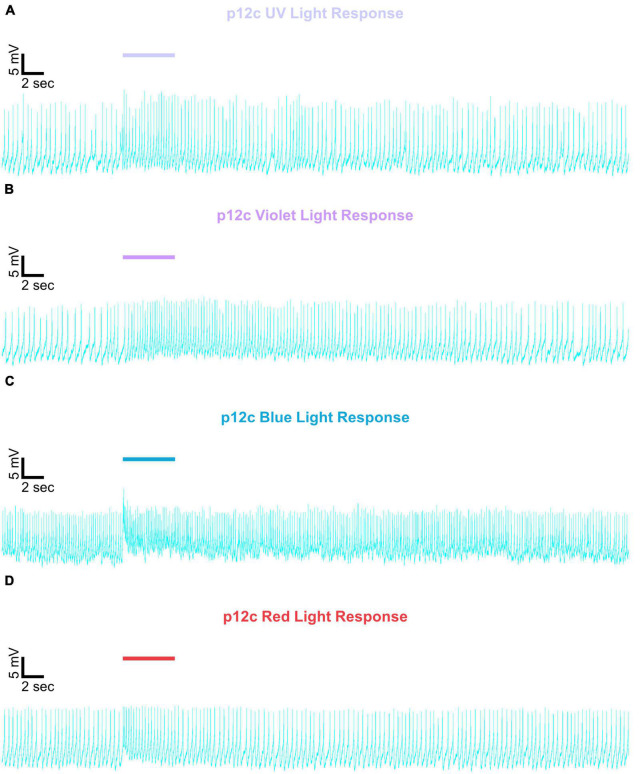
FIGURE 5.
Representative voltage traces of l-LNvs electrophysiological responses to UV, violet, blue, and red light stimulus for native expressed Drosophila CRY. Representative voltage traces of the last 60 s of a patch-clamp recording of l-LNvs subjected to 5 s of (A) UV, (B) violet, (C) blue, and (D) red light stimulus for natively expressed Drosophila CRY, p12c (blue traces). Colored bars indicate 5 s of 200 μW/cm2 light stimulus. Vertical scale bars represent 5 mV and horizontal scale bars represent 2 s.

