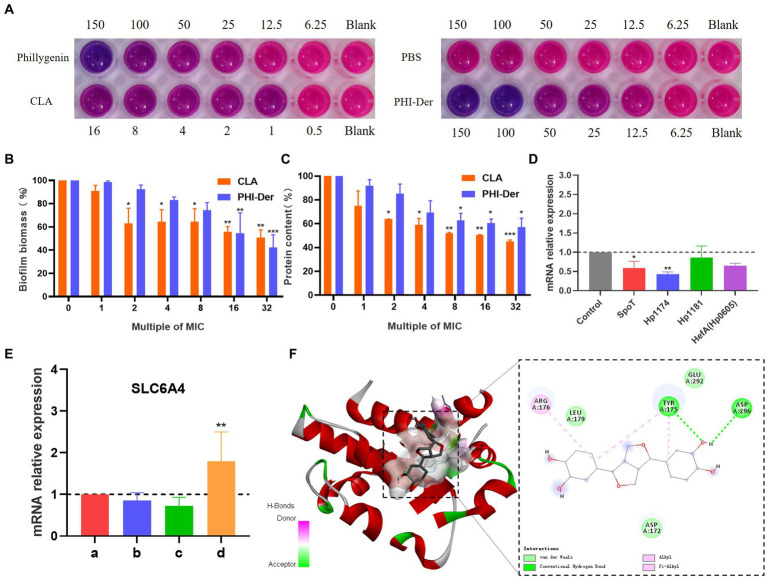
Figure 7.
Inhibitory effect of PHI-Der on biofilms. (A) Alpha blue showing biofilm inhibition. (B) Crystal violet showing biofilm expression. (C) Biofilm protein expression. (D) Changes in the relative messenger RNA (mRNA) expression of biofilm-related genes after the administration of PHI-Der. (E) Changes in the relative expression of SLC6A4 mRNA after the administration of PHI-Der (a: cell group; b: cells + PHI-Der group; c: infected cell group; d: infected cell + PHI-Der group). (F) PHI-Der and SLC6A4 molecule docking. *p < 0.05, **p < 0.01, ***p < 0.001.

