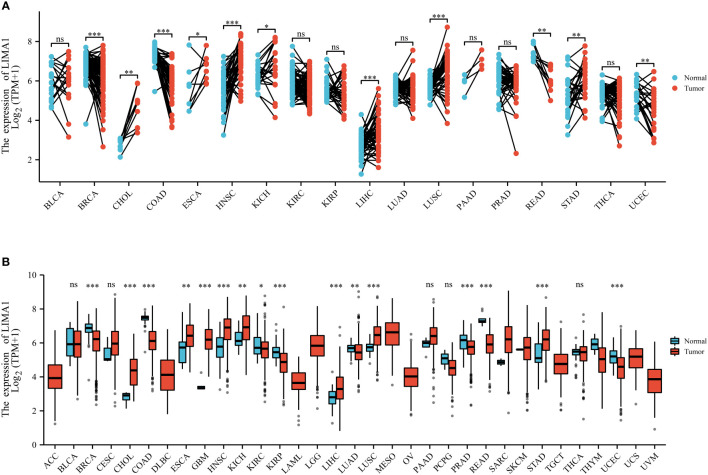
Figure 3.
LIMA1 expression patterns in pan-cancer. (A) LIMA1 expression levels in 33 different types of cancer and non-cancer samples based on The Cancer Genome Atlas Database (TCGA) (https://portal.gdc.cancer.gov/). (B) LIMA1 expression levels in cancer tissues and its paired normal tissues based on TCGA dataset. *p < 0.05, **p < 0.01, ***p < 0.001. "ns" means that there is no statistical difference between the two comparison groups.

