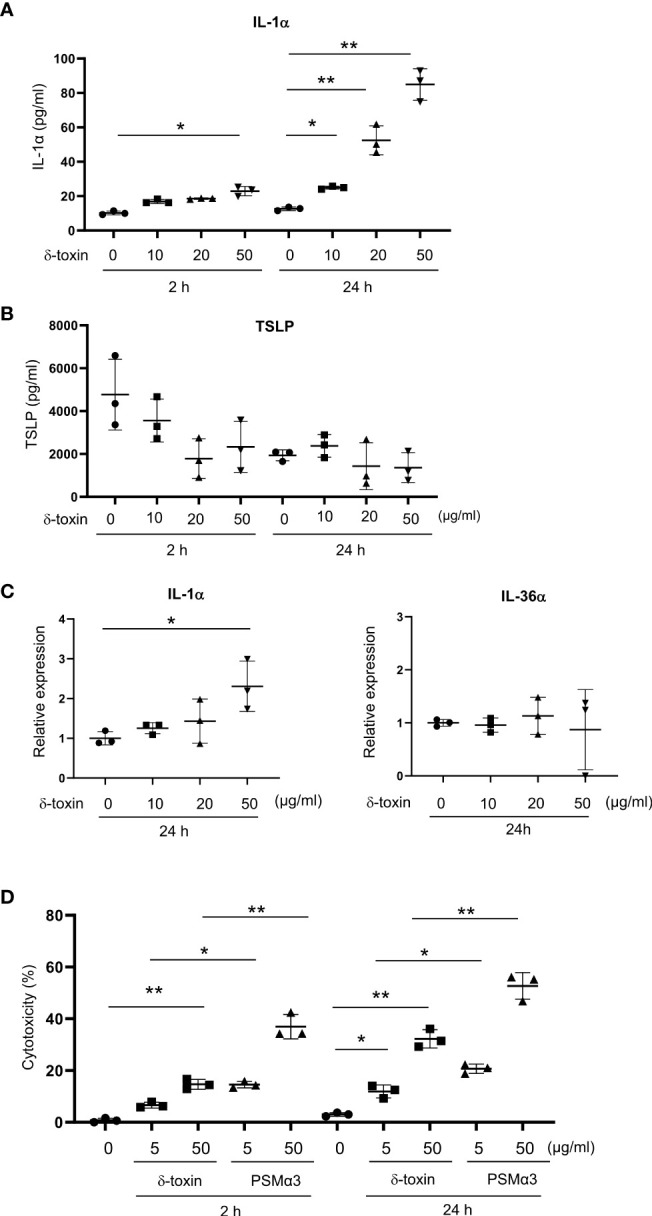
Figure 5.

Murine keratinocytes released IL-1α in response to stimulation with δ-toxin. Murine keratinocytes were stimulated with different concentrations of δ-toxin for 2 or 24 h, as indicated. (A, B) Concentrations of (A) IL-1α and (B) TSLP in the culture supernatants. (C) Relative expression levels of mRNA of IL-1α and IL-36α in the δ-toxin-stimulated keratinocytes. (D) The percentage of dead cells. (A–D) Data are representative of three independent experiments. Means ± SD have been plotted. *P < 0.05 or **P < 0.01.
