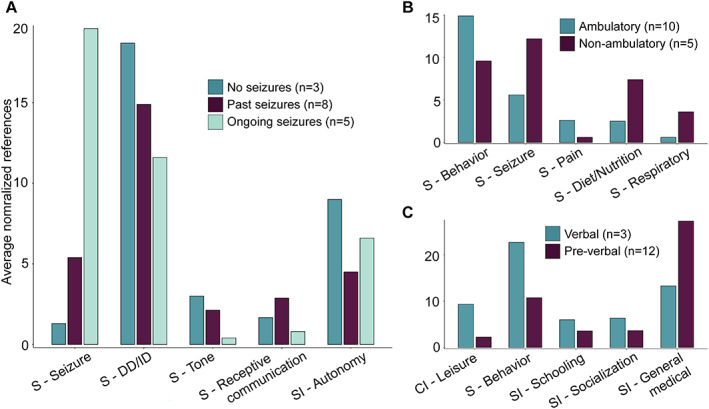
FIGURE 3.

Analysis of subgroups stratified by seizure histories and developmental trajectories. Highlighted are the concepts that were significant across subgroups after correction for multiple testing with a false discovery rate of 5%. Height of each bar indicates the average references of concepts normalized to the number of individuals in each respective subgroup. (A) Differences in concepts across individuals without any history of seizures (n = 3), individuals in seizure remission (n = 8), and individuals with ongoing seizures (n = 5). (B) Differences in concepts across individuals who did not achieve independent ambulation at the time of study inclusion (n = 5) compared to those who achieved independent ambulation (n = 10). (C) Differences in concepts across individuals who did not use words to communicate (nonverbal, n = 12) compared to those who used words to communicate (verbal, n = 3).
