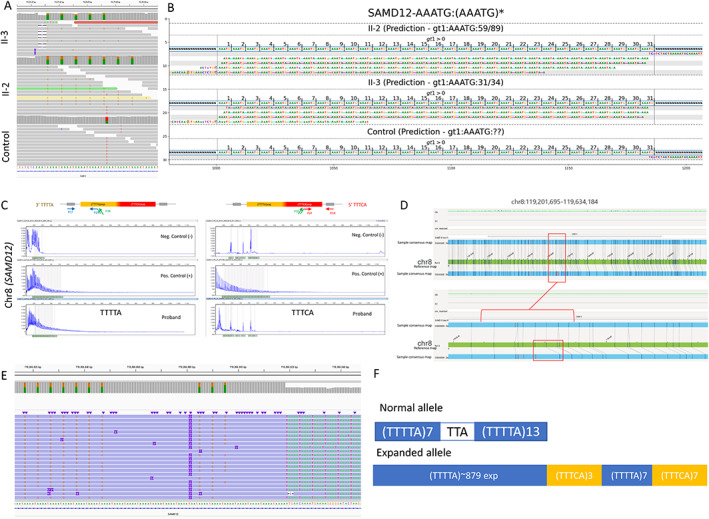
FIGURE 2.

Combined genomics to uncover repeat expansion in FAME siblings. A, Short‐read whole genome sequencing depicted in the Integrative Genomic Viewer (IGV) image from II‐2 and the control clearly showing the heterozygous (TTTCA)7 expansion in the II‐2 and II‐3 but not in unrelated control genomes. B, TTTCA repeats visualized with GraphAlignmentViewer based on ExpansionHunter predictions showing the presence of the TTTCA motif, expanded in II‐2 and II‐3, but absent in unrelated control. C, Repeat‐primed PCR depicting TTTTA repeat expansion in II‐3 but no clear evidence for TTTCA repeat expansion. For TTTTA, positive control and proband show a tail of peaks extending up to more than 600 bp length representing the expansion, which is not present in the negative control individual. However, for TTTCA, the abnormal tail in the positive control is not present in the proband. D, Optical Genome Mapping Bionano's Saphyr depicting heterozygous 4.1 kb repeat expansion in the intron 4 of SAMD12 in II‐2; the region depicted is chr8:119201695‐119634184, hg19. The bottom allele shows a greater size between labels in the consensus map compared with the labels in the reference map. This might denote a small insertion between these two labels, corroborated by the misalignment of subsequent labels in that region. E, CRISPR/Cas9‐targeted enriched LRS showing the heterozygous TTTTA and TTTCA repeat expansion in II‐2. F, Configuration of the repeat expansion in II‐2 based on (D).
