
FIGURE 2.
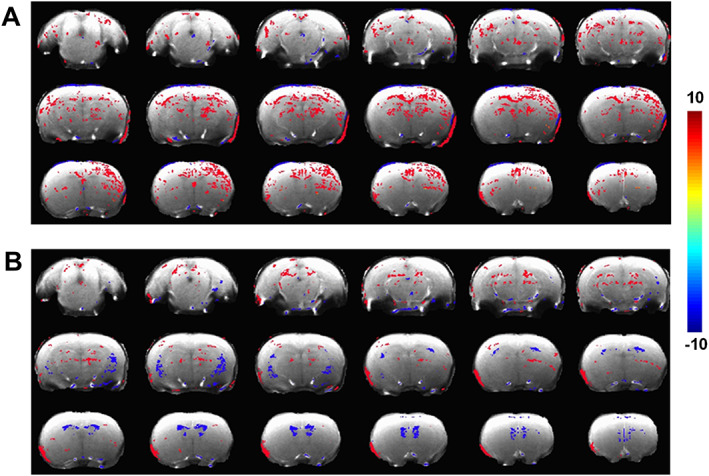
Significant differences in T1 intensities after soman exposure when compared to controls using a two‐tailed t test. A, Female (soman; n = 7) vs (control; n = 4). B, Male (soman; n = 6) vs (control; n = 3). T test was performed in very voxel comparing the two groups. Color overlay depicts active voxels (significantly different; corrected P < 0.05). A family‐wise error control of a minimum cluster of 30 contiguous voxels to correct for multiple comparisons. Hot colors depict T1 intensity increase after soman exposure and cold colors depict T1 intensity decrease after soman exposure.