TABLE 2.
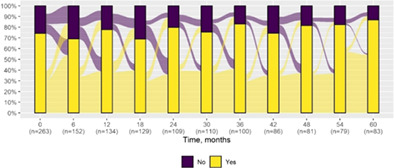
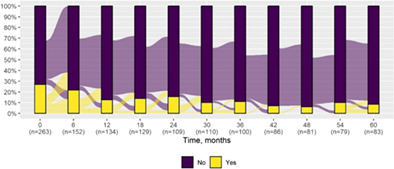
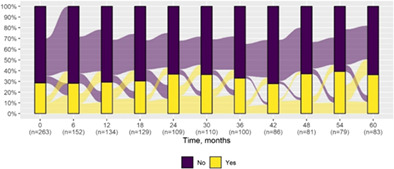
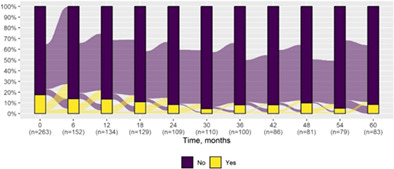
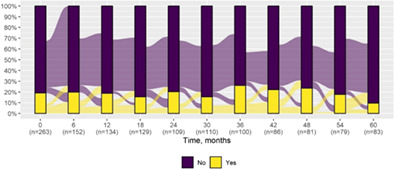
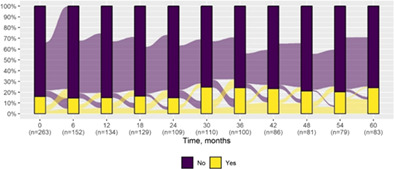
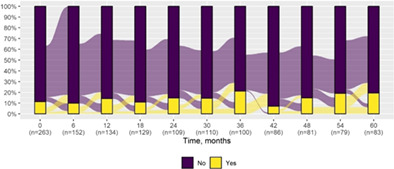
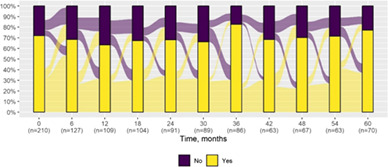
Epilepsy features at first visit and after 5‐year follow‐up with alluvial diagrams showing variation over time.
| First visit | Last visit at 5th year | ||
|---|---|---|---|
| N | 263 | 83 | |
| Age, years | |||
| Median (IQR) | 2.0 (0–7.8) | 11.0 (5.0–18.0) | |
| Generalized seizures* | 195 (74.1) | 72 (86.7) |
|
| Hemiclonic seizures* | 71 (27.0) | 7 (8.4) |
|
| Focal‐onset seizures | 75 (28.5) | 30 (36.1) |
|
| Status epilepticus | 46 (17.5) | 7 (8.4) |
|
| Massive myoclonus | 50 (19.0) | 8 (9.6) |
|
| Absence seizures | 42 (16.0) | 20 (24.1) |
|
| Reflex seizures | 20 (7.6) | 5 (6.0) | |
| Seizure clusters | 30 (11.4) | 16 (19.3) |
|
| Febrile seizures | 151 (71.9) | 6 (75.0) |
|
Statistically significant difference between first and last visit (p‐value <0.05).
