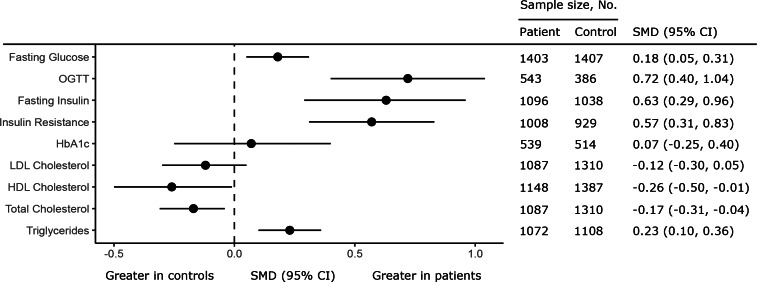
Fig. 2.
Forest plot showing summary effect sizes for mean differences in glucose, insulin, and lipid parameters in antipsychotic naïve FEP compared with healthy controls. Each circle shows the summary effect size (SMD); the horizontal line running through each square illustrates the width of the overall 95% CI. There was a significant elevation in fasting glucose, glucose levels measured using an OGTT, fasting insulin, insulin resistance as measured using HOMA-IR, and triglyceride levels in patients compared with controls. There was a significant decrease in total and HDL-cholesterol levels in patients compared with controls. There was no significant difference in HbA1c or LDL-cholesterol levels in patients compared with controls.

