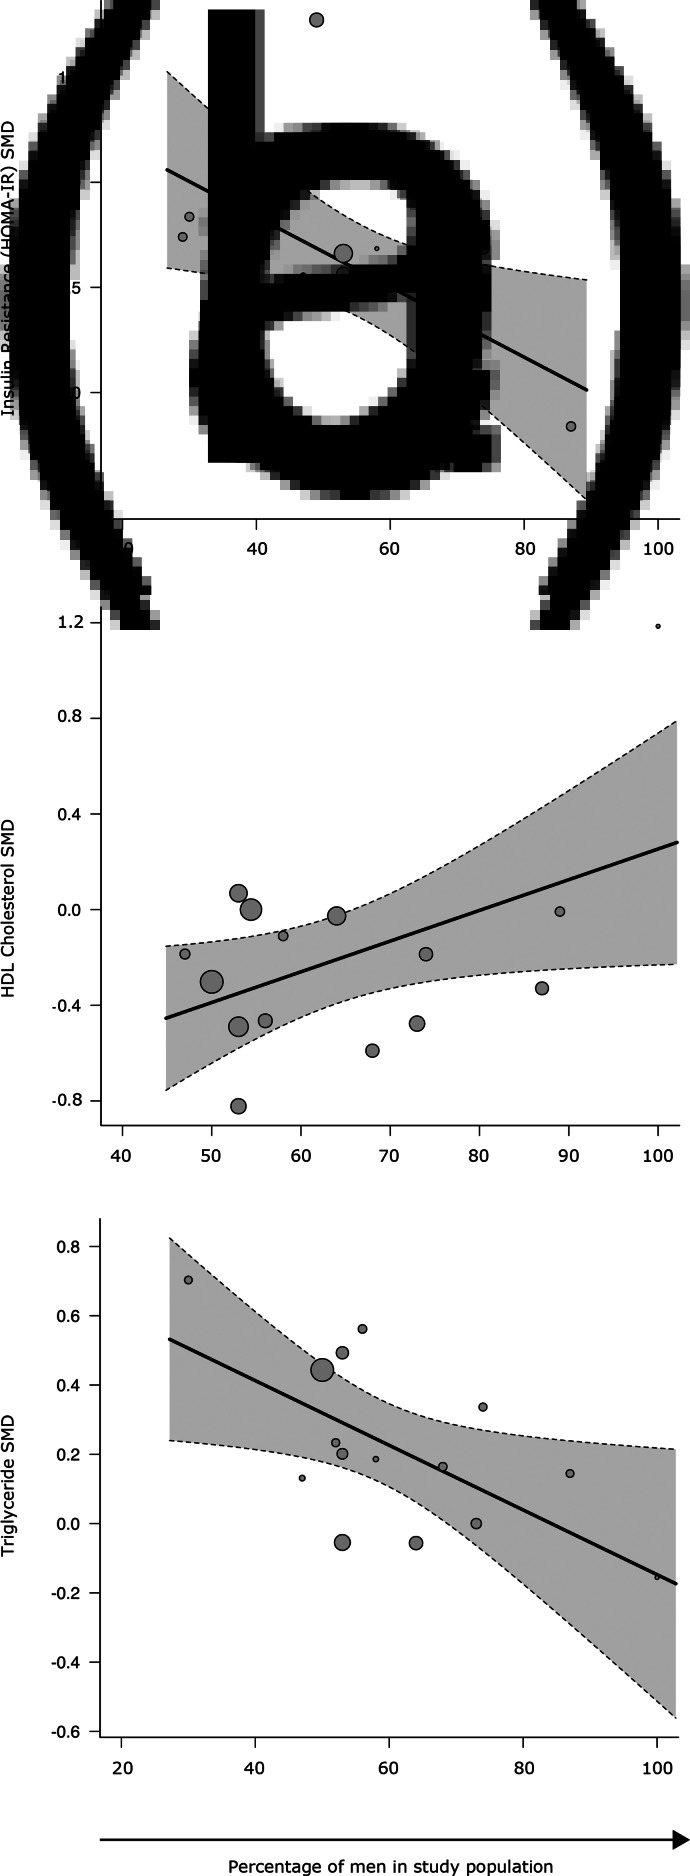
Fig. 3.
Scatterplots for regression of SMD between patients and controls for metabolic parameters on percentage of men in the patient population. (a) Percentage of males in the sample was significantly associated with lower effect size for insulin resistance (as measured using HOMA-IR) effect size (z = −2.32, r = −0.98, p = 0.02); (b) percentage of males was significantly associated with lower HDL-cholesterol effect size (z = 2.02, r = 0.97, p = 0.04); and (c) percentage of males was significantly associated with lower triglyceride effect size (z = −2.18, r = −0.98, p = 0.03). Each circle represents a study, its size corresponding to the study weight. Single straight line represents the regression coefficient, the curved dotted lines the 95% CI.

