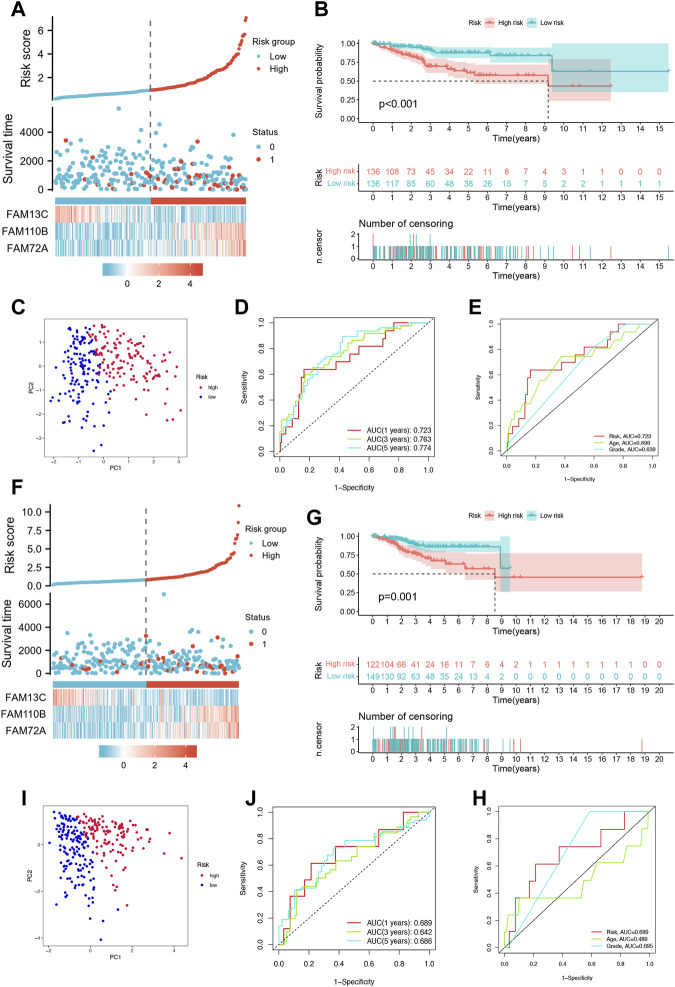
FIGURE 3.
Validation of the prognosis signature for FFGs. (A) Heat map of risk factors in the train cohort. (B) K-M survival curve of UCEC patients in the train cohort. (C) PCA plot in the train cohort. (D) Time-dependent ROC curve of UCEC patients in the train cohort. (E) Multi-index ROC analysis in the train cohort. (F) Heatmap of risk factor in the test cohort. (G) K-M survival curve of UCEC patients in the test cohort. (H) PCA plot in the test cohort. (I) Time-dependent ROC curve of UCEC patients in the test cohort. (J) Multi-index ROC analysis in the test cohort.

