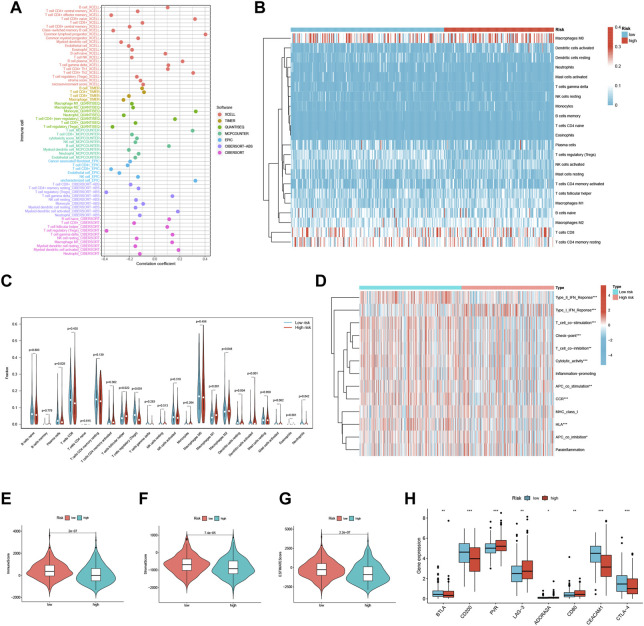
FIGURE 6.
TME and immune cell infiltration in the two risk score groups. (A) Immune cell bubble plots of the risk groups. (B) Heat map showing the correlation between the 22 TICs. Correlation tests were performed with Pearson’s coefficient. (C) The ratio of immune cells between high-risk and low-risk groups. (D) Immune function and immune cell ssGSEA scores between high-risk and low-risk groups. (E) Immune score, (F) stromal score, (G) ESTIMATE score, (H) immune checkpoint between high-risk and low-risk groups *p < 0.05; **p < 0.01; ***p < 0.001.

