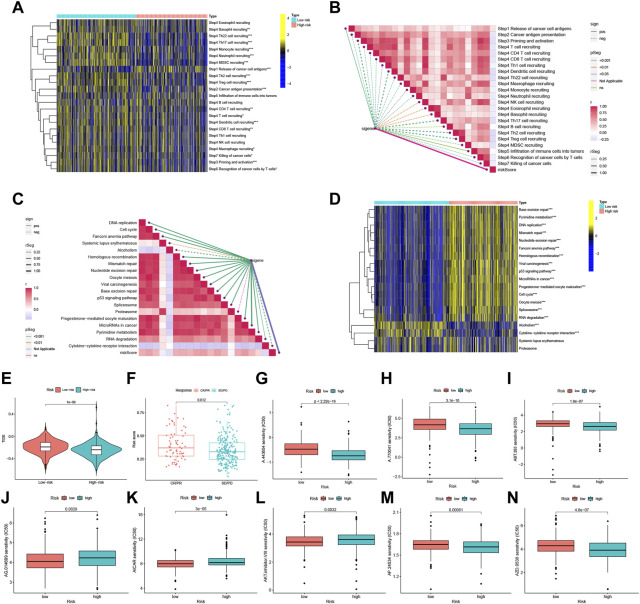
FIGURE 7.
FFGs risk score predicts treatment response assessment. (A) Heat map of differences in the individual steps of the cancer-immune cycle between high and low risk groups. (B) Correlation of different risk scores with steps of the cancer-immune cycle. (C) Correlation of different risk scores with enrichment scores of immunotherapy prediction pathways. (D) Correlation between different risk scores and clinical response to immunotherapy. (E) Box-line graphs of TIDE scores in the high-risk versus low-risk groups in the TCGA UCEC cohort. (F) Correlation between risk scores and clinical response to cancer immunotherapy. Differences in IC50 of immunotherapy drugs by risk score (G) A.443654, (H) A.770041, (I) ABT.263, (J) AG.014699, (K) AICAR, (L) AKT. inhibitor, (M) AP.24534, (N) AZD.0530. PD, disease progression; SD, disease Stable; PR, partial response; CR, complete response. TIDE, Tumor Immune Dysfunction and Exclusion. *p < 0.05, **p < 0.01, ***p < 0.001.

