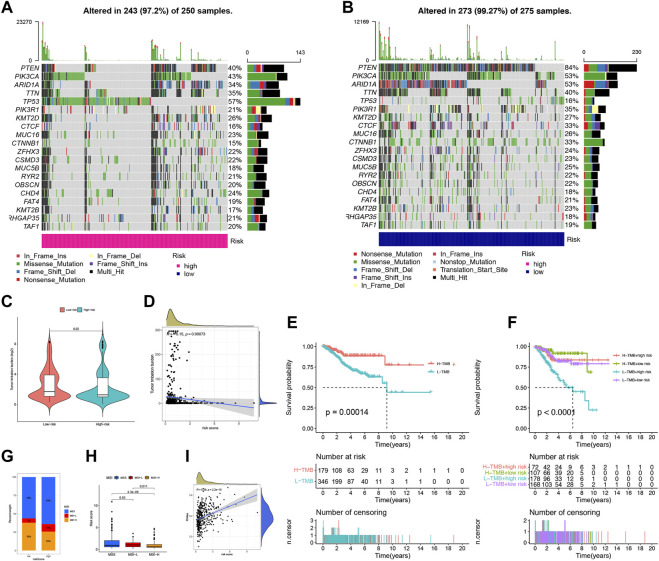
FIGURE 8.
Landscape of mutation profiles in UCEC samples. (A,B) The hub-mutated markers in both groups. (C) The TMB between high-risk and low-risk patients. (D) Correlation between the TMB and risk score. (E) Kaplan-Meier analysis showing the relationship between the level of TMB and clinical outcome (p = 0.00014). (F) Effects of distinct TMB in different Risks on the survival probability (p < 0.001). (G) The proportion of different MSI in the high-risk and low-risk score groups. (H) The relationship between the MS and risk score. (I) The correlation relationship between FFGs expression and CSC index.

