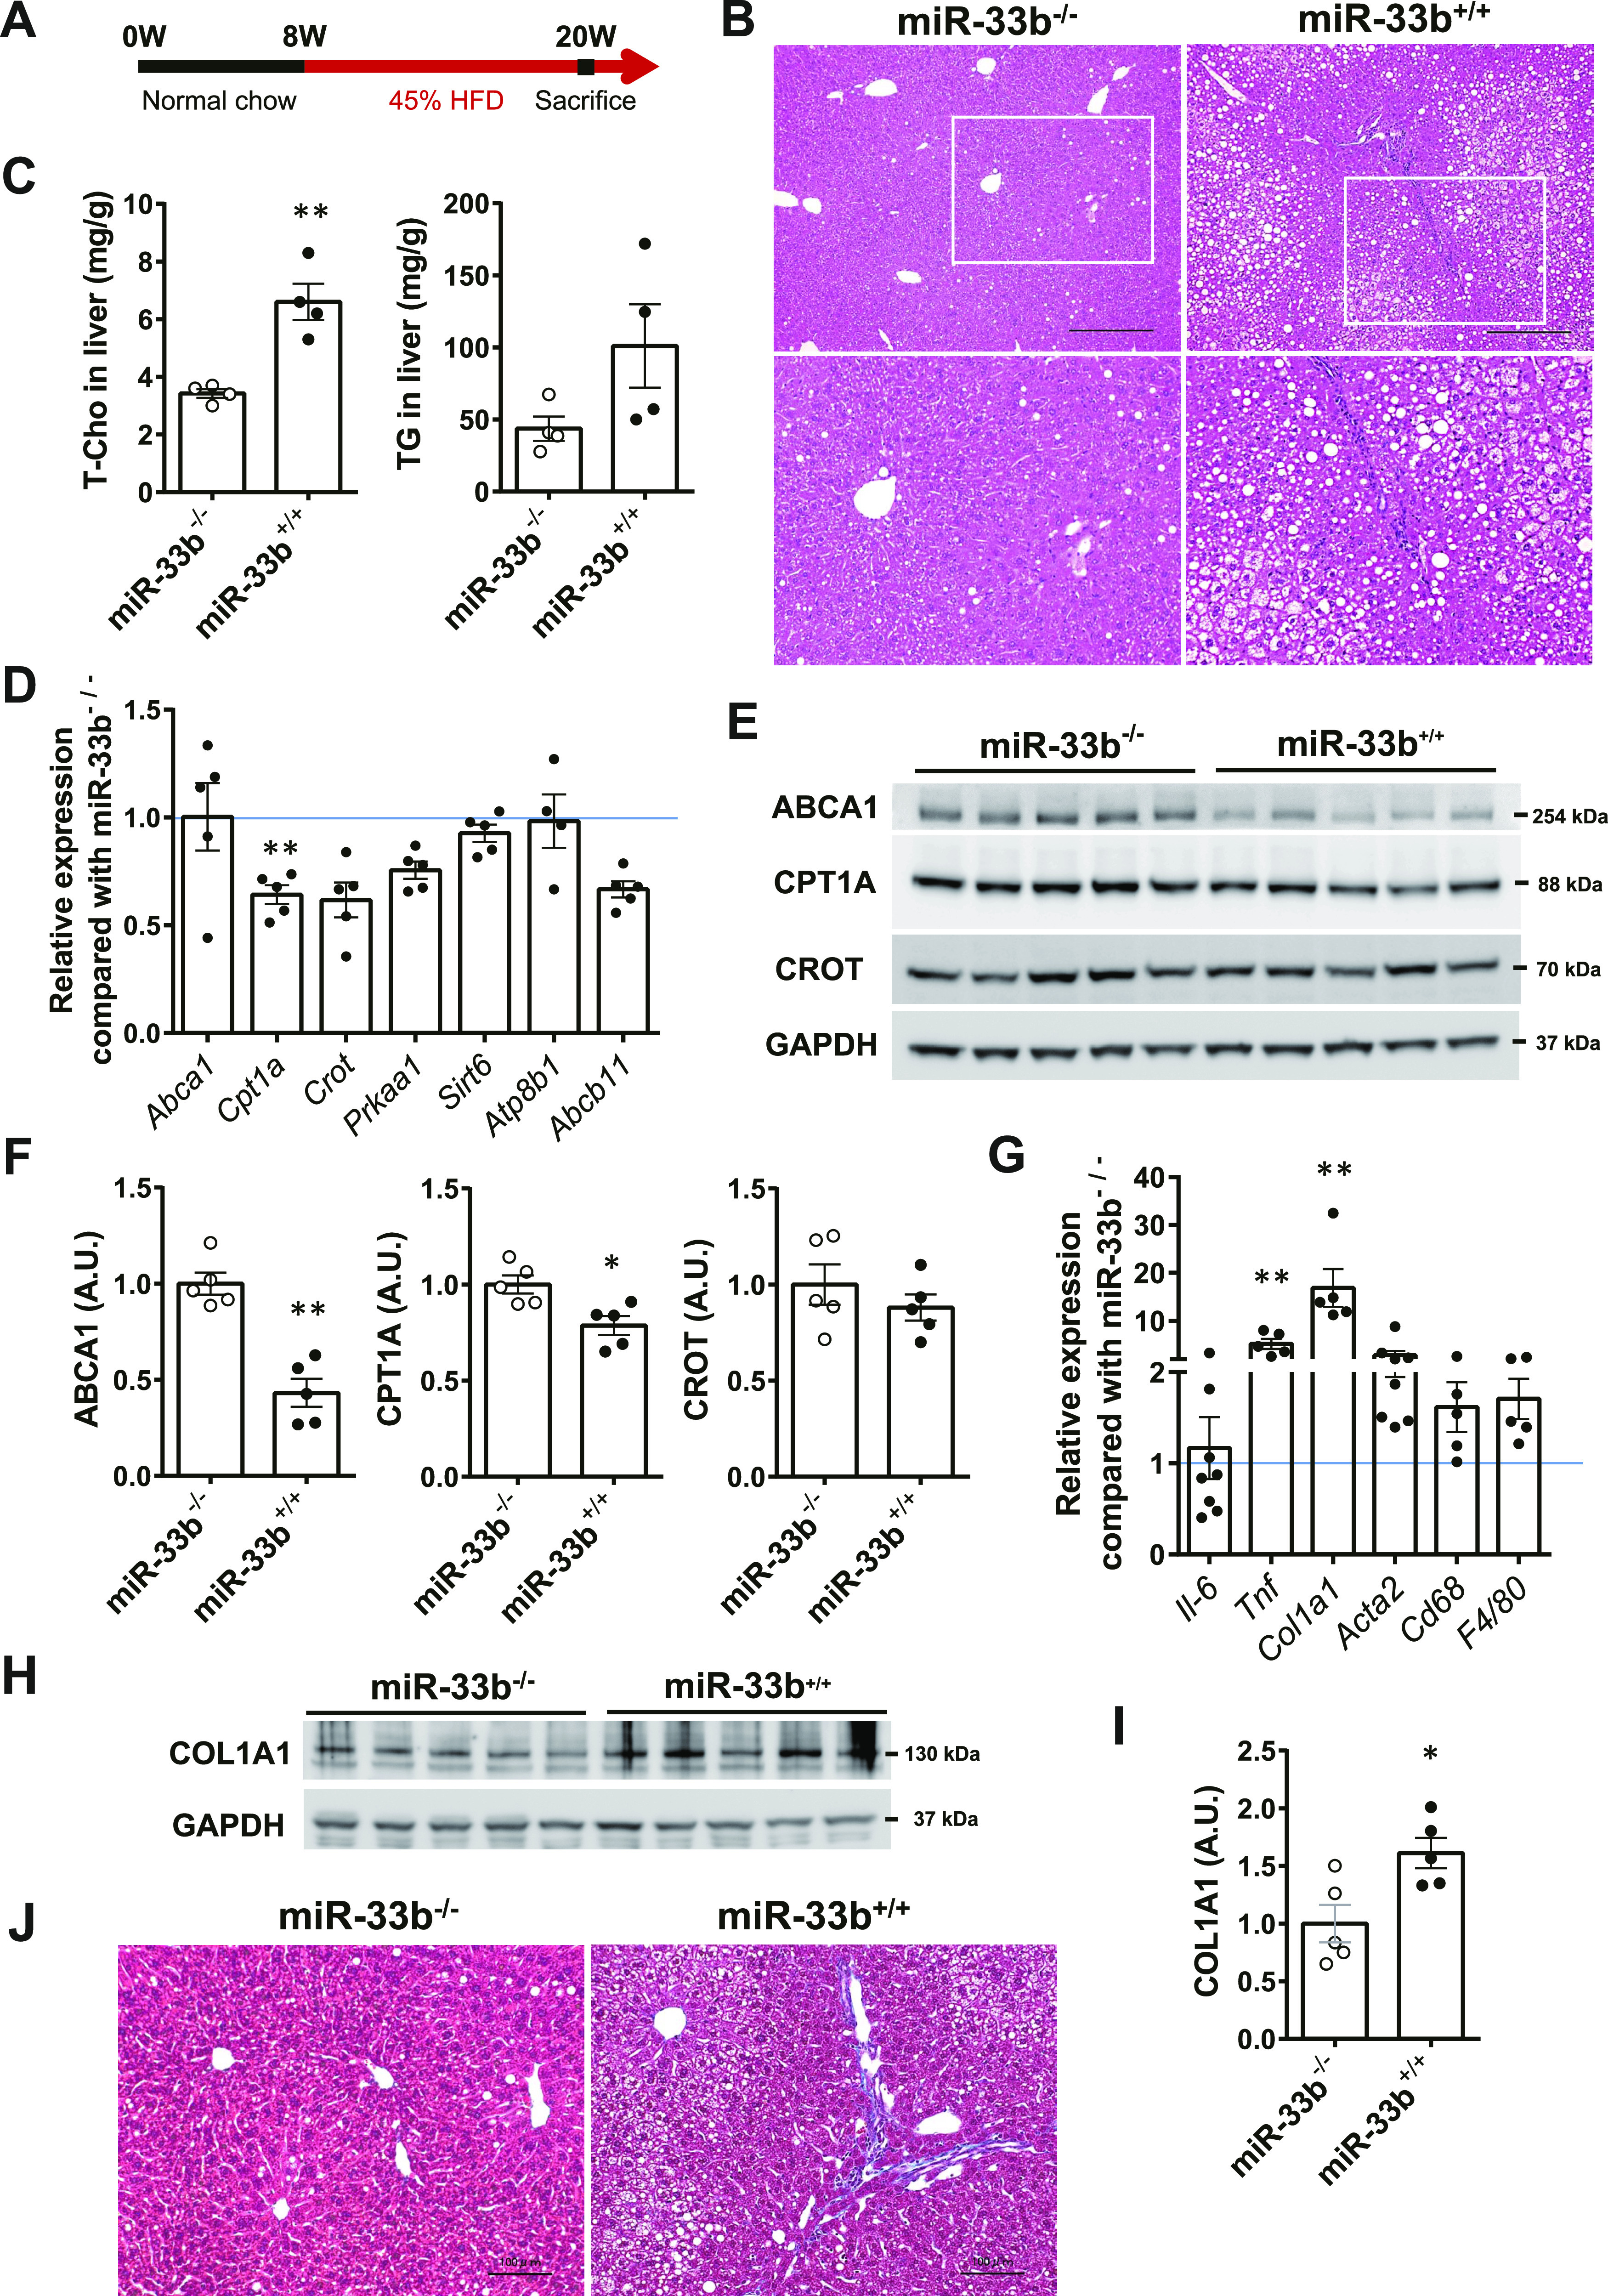
Figure 1. miR-33b KI mice exhibit the NASH phenotype under HFD feeding.

(A) Scheme of the HFD feeding protocol. (B) Representative microscopic images of HE staining of the liver of miR-33b−/− and miR-33b+/+ mice fed the HFD. Scale bars: 300 μm (upper). (C) Total cholesterol and triglyceride levels in the livers of miR-33b−/− and miR-33b+/+ mice fed the HFD. n = 4 mice per group; **P < 0.01, unpaired t test. (D) Relative expression levels of miR-33 target genes in the livers of miR-33b−/− and miR-33b+/+ mice fed the HFD. n = 4–5 mice per group; **P < 0.01, unpaired t test. (E) Western blotting analysis of ABCA1, CPT1A, and CROT expression in the livers of miR-33b−/− and miR-33b+/+ mice fed the HFD. GAPDH was used as a loading control. n = 5 mice per group. (F) Densitometry of hepatic ABCA1, CPT1A, and CROT. n = 5 mice per group; *P < 0.05 and **P < 0.01, unpaired t test. (G) Relative expression levels of inflammatory genes and fibrosis-related genes in the livers of miR-33b−/− and miR-33b+/+ mice fed the HFD. n = 5–8 mice per group; **P < 0.01, unpaired t test. (H) Western blotting analysis of COL1A1 expression in the livers of miR-33b−/− and miR-33b+/+ mice fed the HFD. GAPDH was used as a loading control. n = 5 mice per group. (I) Densitometry of hepatic COL1A1. n = 5 mice per group; *P < 0.05, unpaired t test. (J) Representative microscopic images of Masson’s trichrome staining of the livers of miR-33b−/− and miR-33b+/+ mice fed the HFD. Scale bars: 100 μm.
