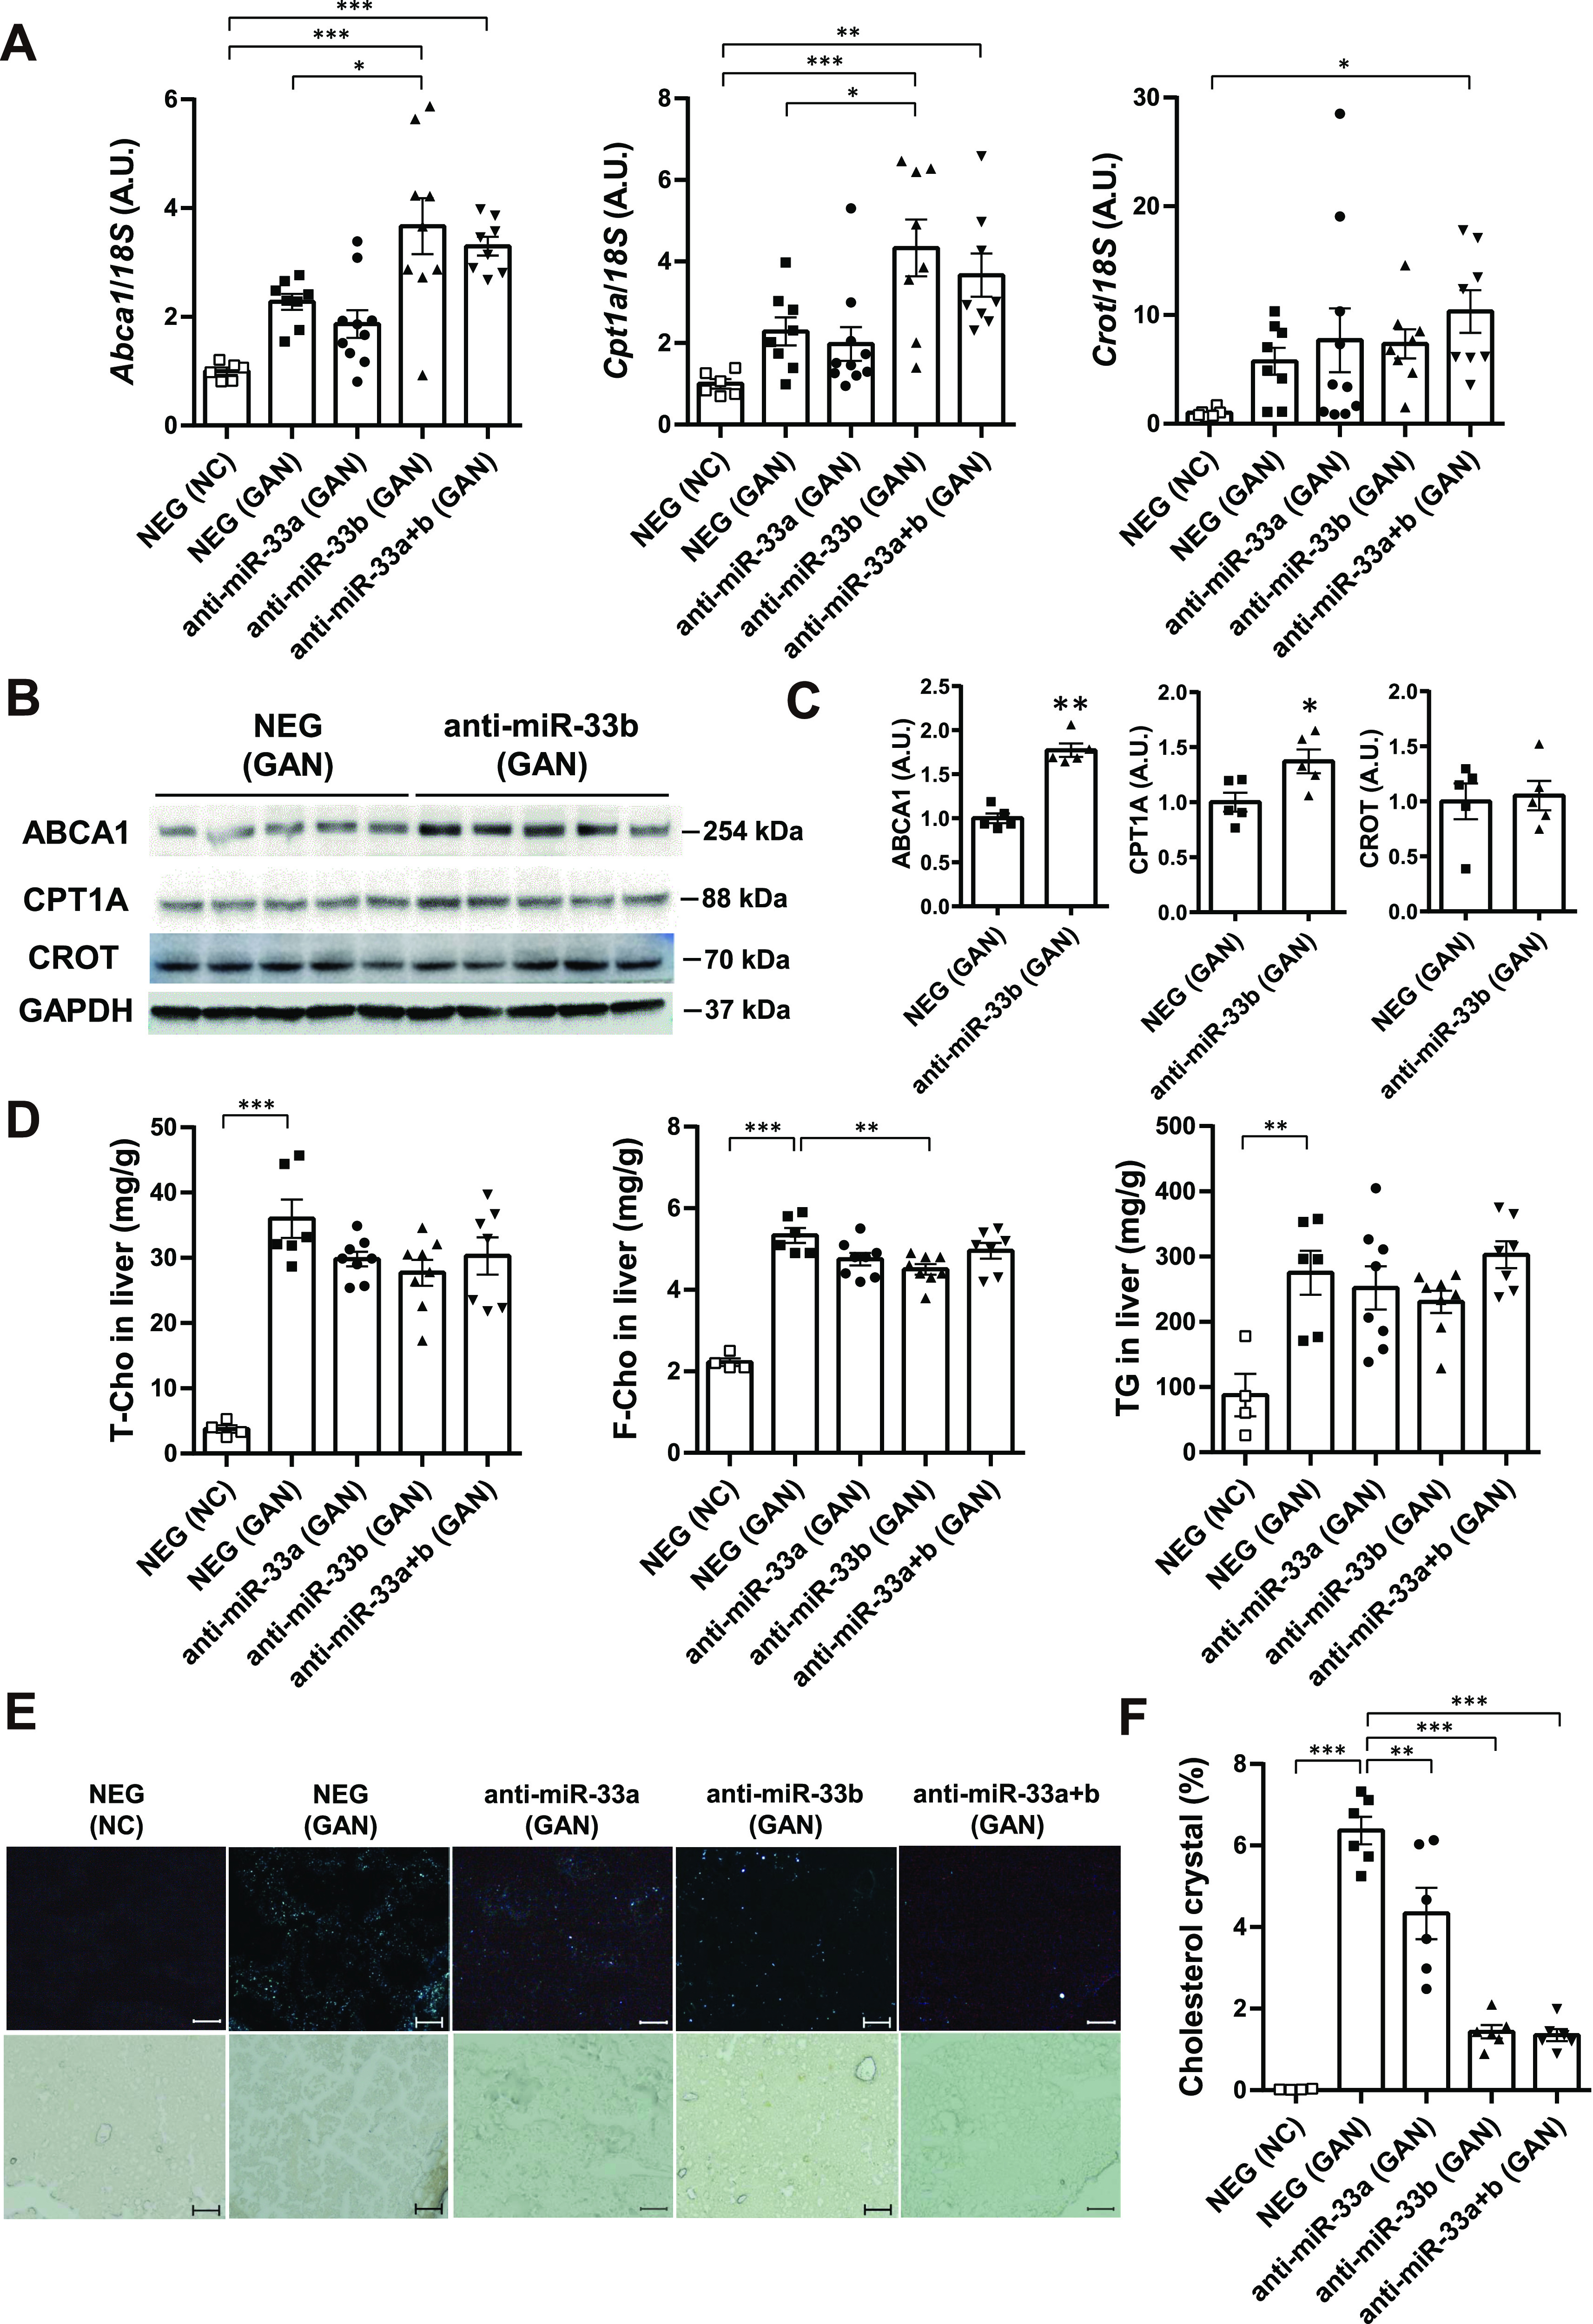
Figure 4. Anti-miR-33 treatment with the GAN diet improves the lipid profile in the serum and liver.

(A) Relative expression levels of Abca1, Cpt1a, and Crot in the livers of the indicated groups. n = 6–10 samples per group; *P < 0.05 and ***P < 0.001, one-way ANOVA with Tukey’s post hoc test. (B) Western blotting analysis of ABCA1, CPT1A, and CROT expression in the livers of the indicated groups. GAPDH was used as a loading control. n = 5 samples per group. (C) Densitometry of hepatic ABCA1, CPT1A, and CROT. n = 5 mice per group; *P < 0.05 and **P < 0.01, unpaired t test. (D) Total cholesterol, free cholesterol, and triglyceride levels in the livers of the indicated groups. n = 4–7 samples per group; **P < 0.01 and ***P < 0.001, one-way ANOVA with Tukey’s post hoc test. (E) Representative images of cholesterol crystals with and without a polarizing filter in the liver sections of the indicated groups. (F) Quantification of cholesterol crystal in the liver sections. n = 4–6 samples per group; **P < 0.01 and ***P < 0.001, one-way ANOVA with Tukey’s post hoc test.
