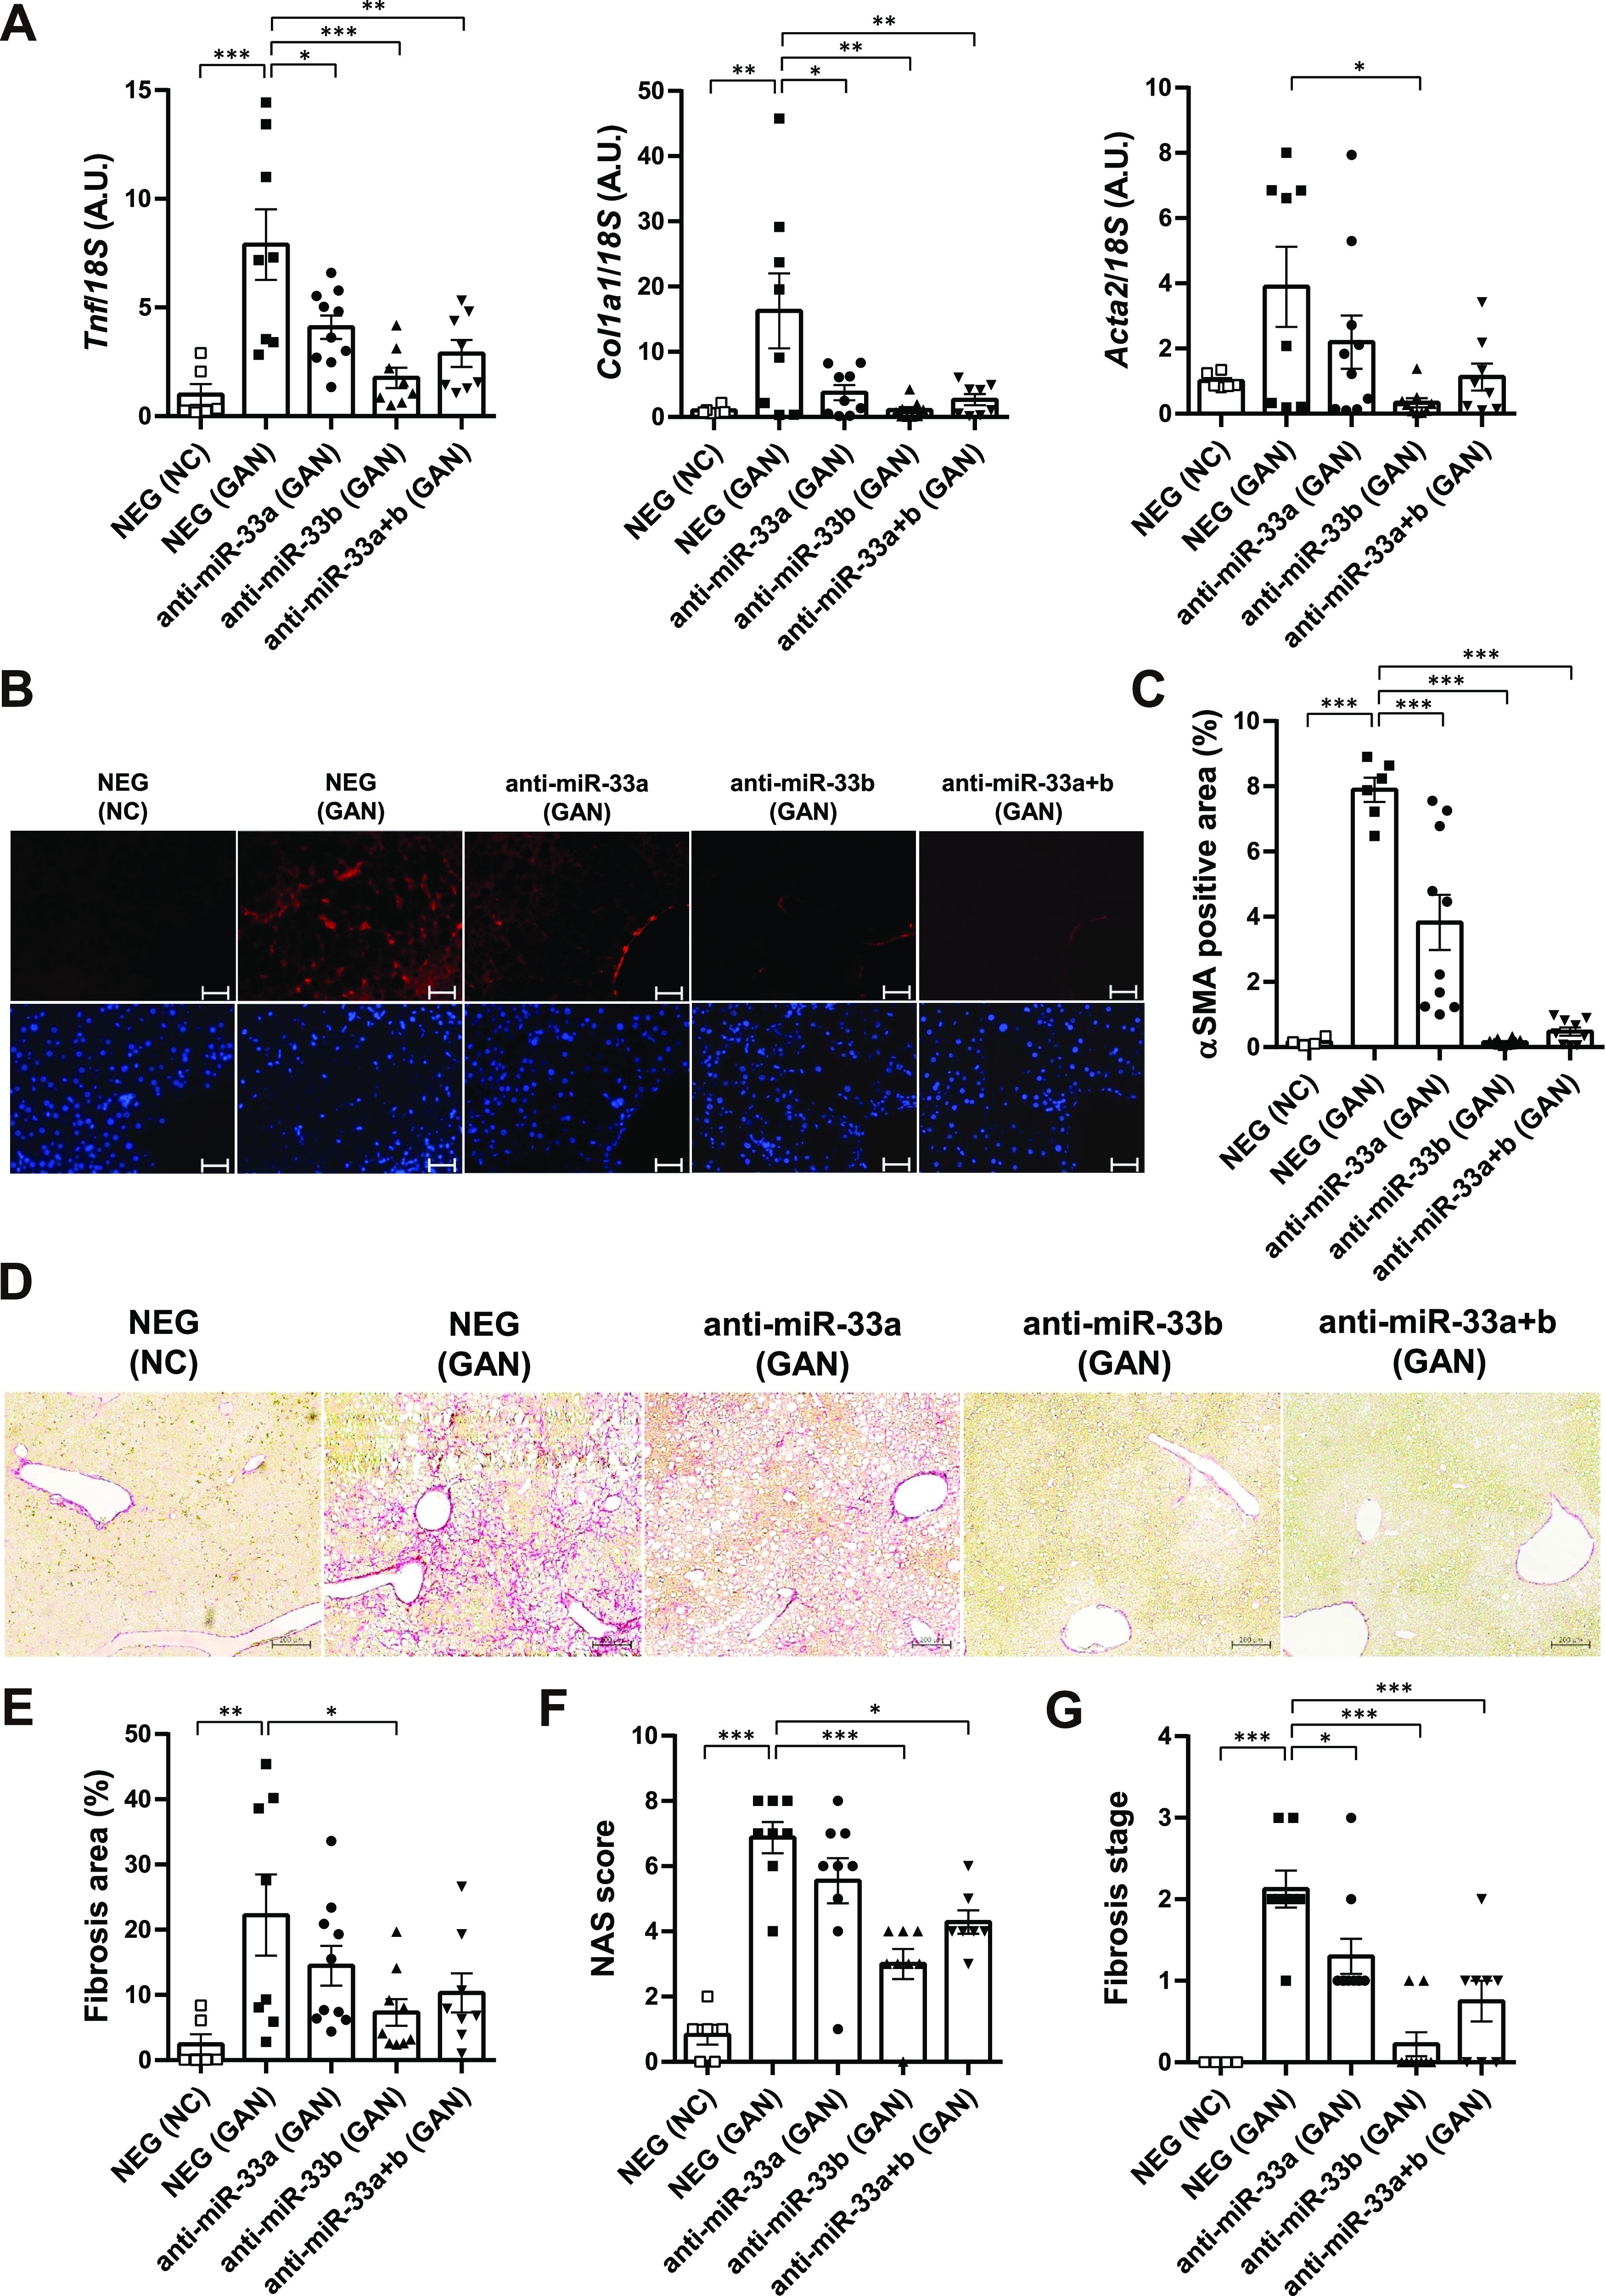
Figure 5. Anti-miR-33 treatment improves GAN diet–induced inflammation and fibrosis.

(A) Relative expression levels of Tnf, Col1a1, and Acta2 in the livers of the indicated groups. n = 6–10 samples per group; *P < 0.05, **P < 0.01, and ***P < 0.001, one-way ANOVA with Tukey’s post hoc test. (B) Representative microscopic images of immunofluorescence staining for αSMA (red) and DAPI (blue). Scale bars: 100 μm. (C) Quantification of the αSMA-positive area in the liver sections of the indicated groups. n = 4–10 samples per group; ***P < 0.001, one-way ANOVA with Tukey’s post hoc test. (D) Representative microscopic images of Picro-Sirius red staining of the livers of the indicated groups. Scale bars: 200 μm. (E) Quantification of the fibrosis area in the liver sections according to Picro-Sirius red staining. n = 6–10 samples per group; *P < 0.05 and **P < 0.01, one-way ANOVA with Tukey’s post hoc test. (F) NAS in the liver sections of the indicated groups. n = 6–10 samples per group; *P < 0.05 and ***P < 0.001, one-way ANOVA with Tukey’s post hoc test. (G) Fibrosis stage in the liver sections of the indicated groups. n = 4–10 samples per group; *P < 0.05 and ***P < 0.001, one-way ANOVA with Tukey’s post hoc test.
