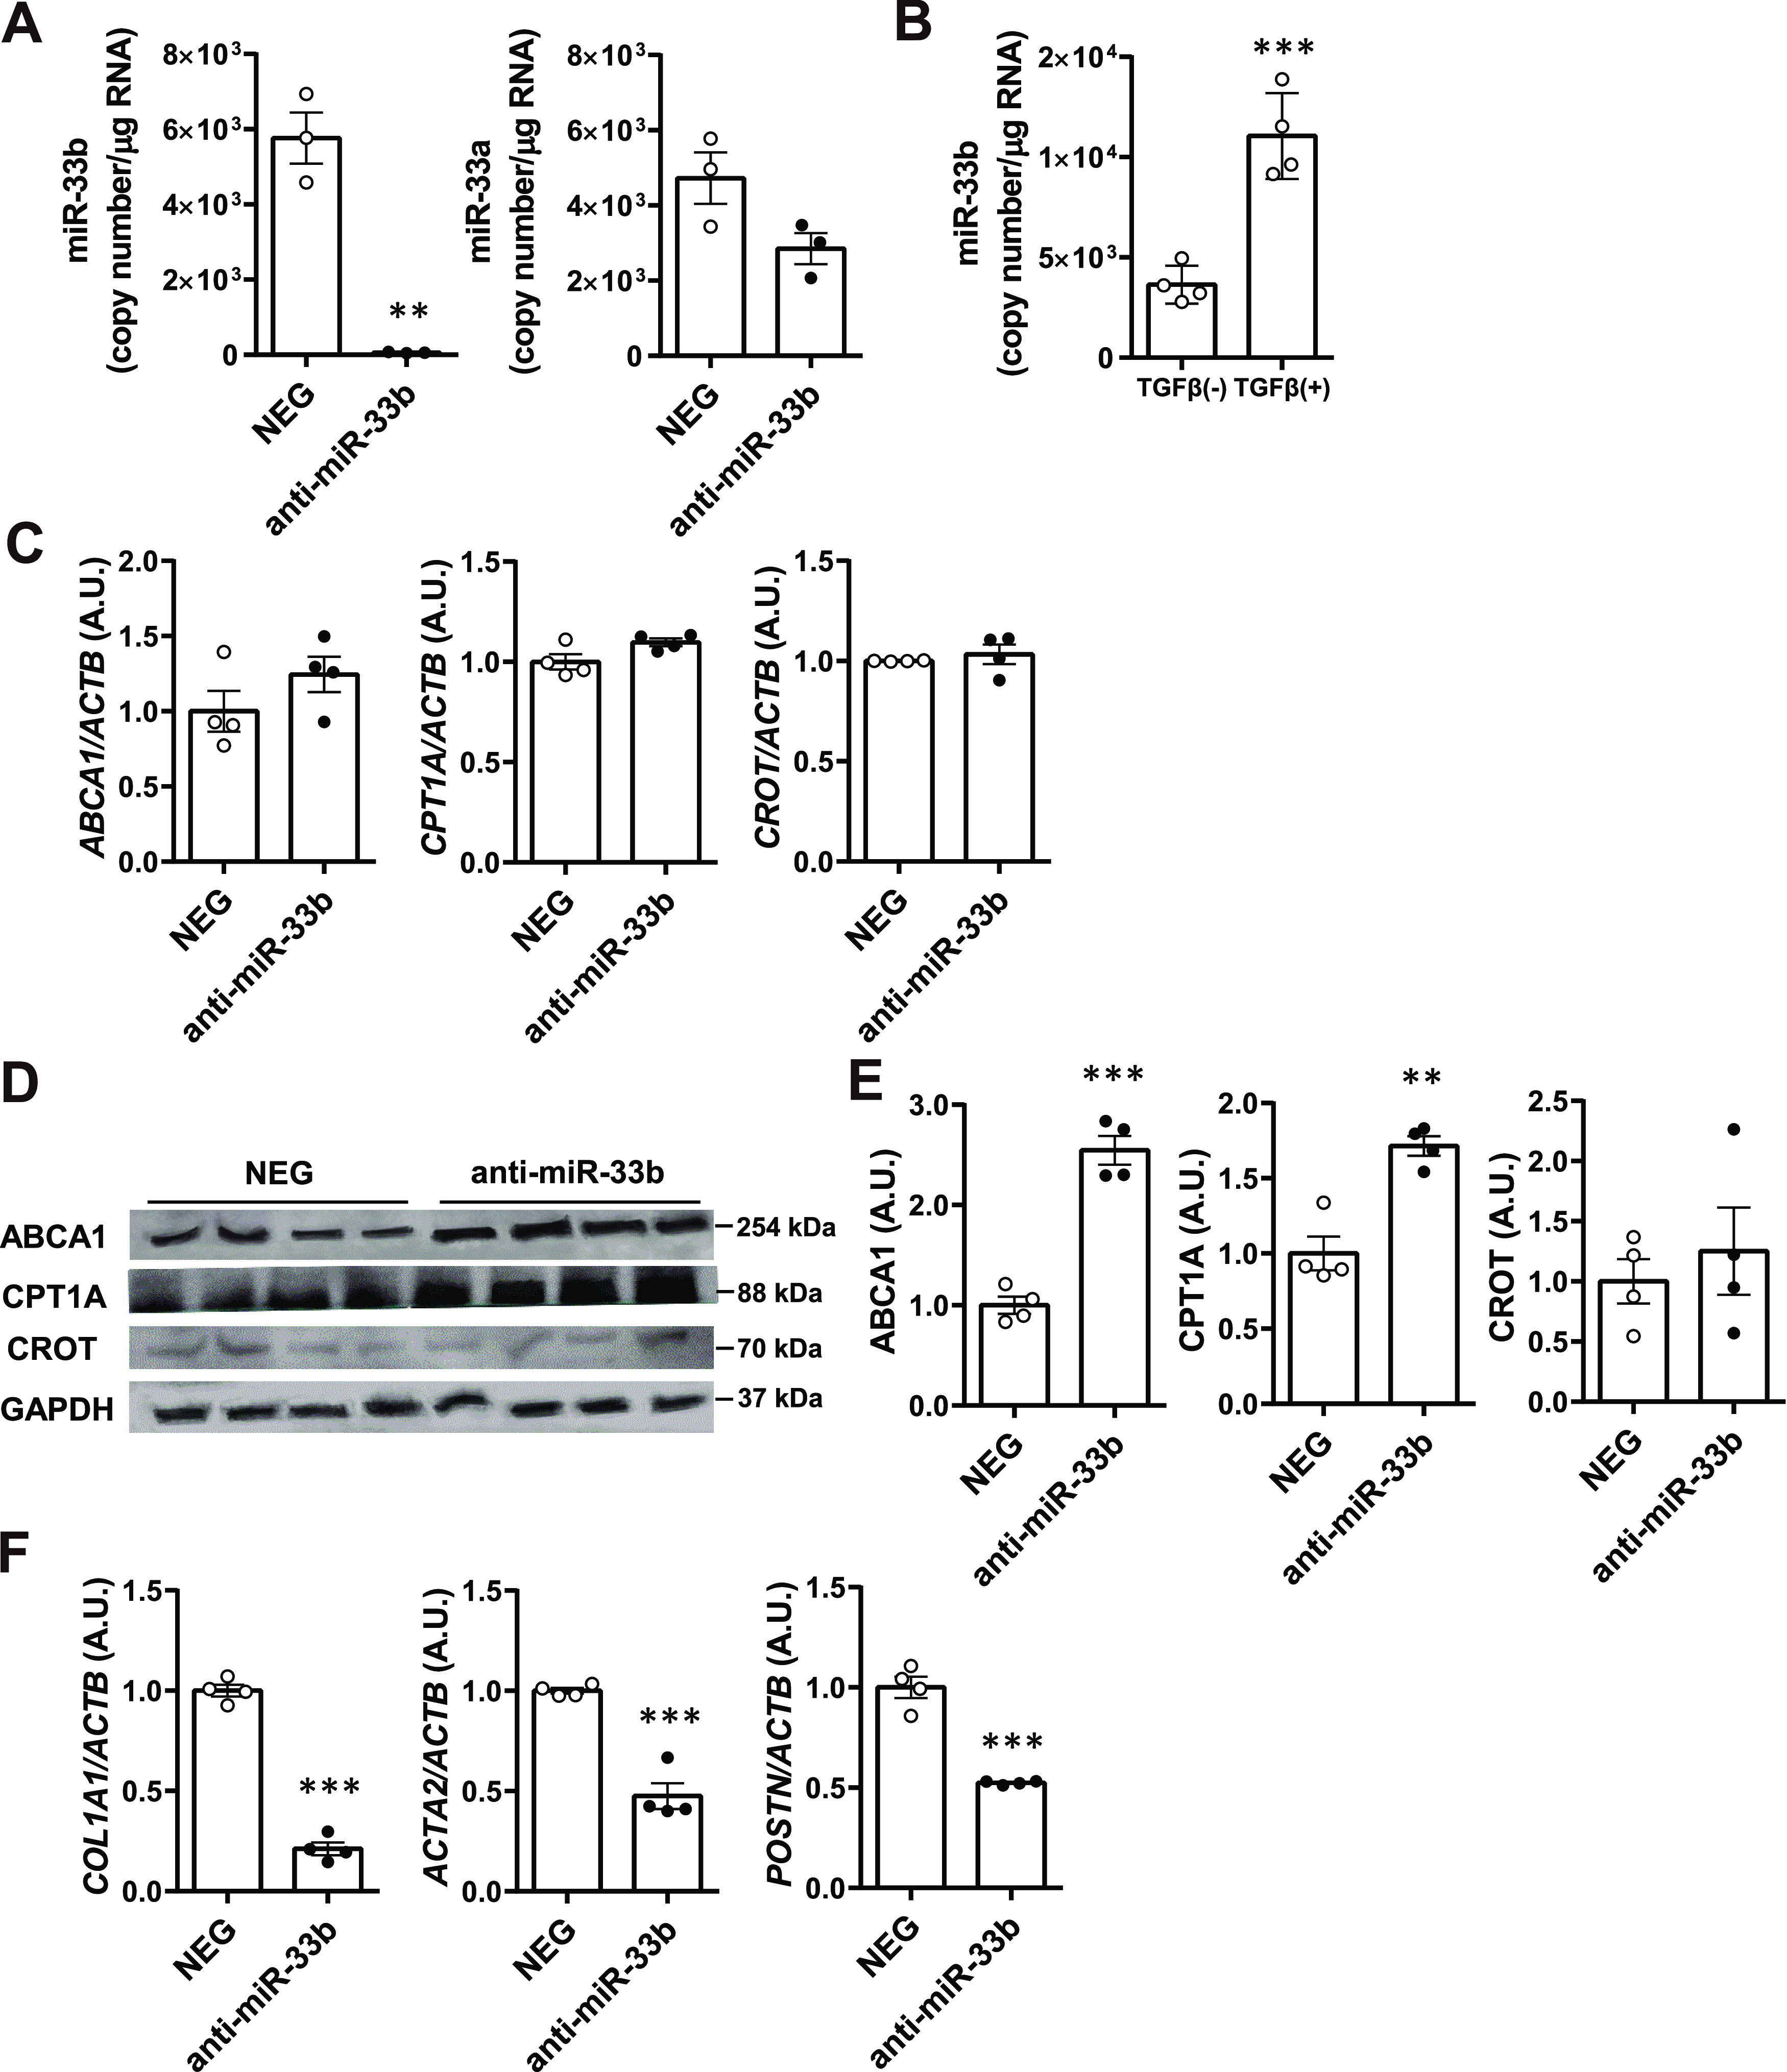
Figure 6. Anti-fibrotic effect of anti-miR-33b treatment in cultured human HSCs.

(A) Relative expression levels of miR-33b and miR-33a in LI90 cells treated with a negative control or anti-miR-33b. n = 3 cells per group; **P < 0.01, unpaired t test. (B) Relative expression levels of miR-33b in LI90 cells treated or not treated with TGF-β. n = 3 cells per group; ***P < 0.001, unpaired t test. (C) Relative expression levels of ABCA1, CPT1A, and CROT in LI90 cells treated with a negative control or anti-miR-33b. n = 4 cells per group. (D) Western blotting analysis of ABCA1, CPT1A, and CROT expression in LI90 cells treated with a negative control or anti-miR-33b. n = 4 cells per group. (E) Densitometry of ABCA1, CPT1A, and CROT in LI90 cells treated with a negative control or anti-miR-33b. n = 4 cells per group; **P < 0.01 and ***P < 0.001, unpaired t test. (F) Relative expression levels of COL1A1, ACTA2, and POSTN in LI90 cells treated with a negative control or anti-miR-33b. n = 4 cells per group.
