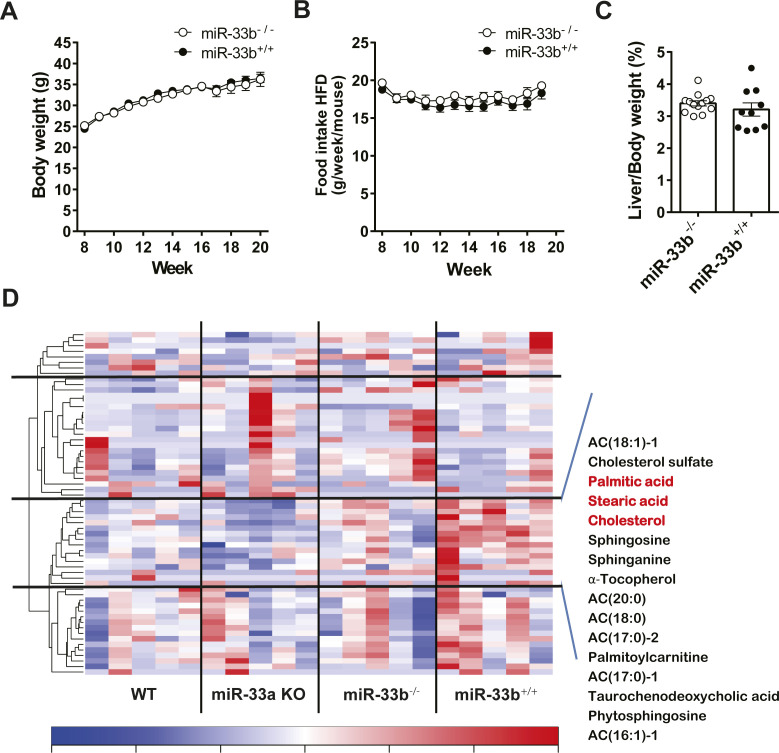
Figure S1. miR-33b KI mice under HFD feeding.
(A) Body weight change of miR-33−/− and miR-33+/+ mice under HFD feeding. (B) Trajectories of weekly food intake (g) per mouse over a 12-wk period. (C) Percentage of liver weight to body weight of miR-33−/− and miR-33+/+ mice fed the HFD. n = 10 mice per group. (D) Metabolomics analysis in the liver of miR-33a KO and miR-33b KI mice. Littermate WT mice for each genotype were used as controls. n = 5 mice per group.

