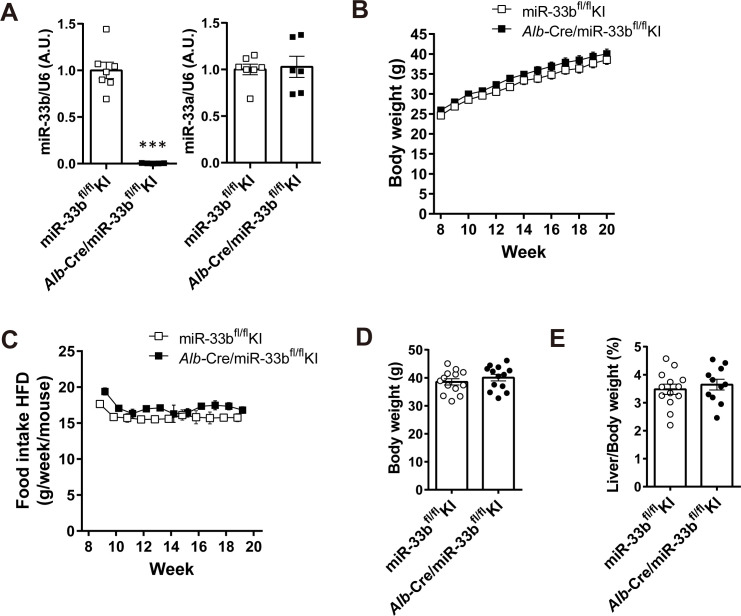
Figure S4. Alb-Cre/miR-33bfl/fl KI mice under HFD feeding.
(A) Relative expression levels of miR-33b and miR-33a in the livers of miR-33bfl/fl KI and Alb-Cre/miR-33bfl/fl KI mice at 8 wk of age. n = 6–7 mice per group; ***P < 0.001, unpaired t test. (B) Body weight change of miR-33bfl/fl KI mice and Alb-Cre/miR-33bfl/fl KI mice under HFD feeding. (C) Trajectories of weekly food intake (g) per mouse over a 12-wk period. (D) Body weight at the time of euthanasia of miR-33bfl/fl KI mice and Alb-Cre/miR-33bfl/fl KI mice fed the HFD. n = 13 mice per group. (E) Percentage of liver weight to body weight of miR-33bfl/fl KI mice and Alb-Cre/miR-33bfl/fl KI mice fed the HFD. n = 11–13 mice per group.

